
 Tweet
Tweet
Thank you!! It's NSTK - they just announced a j/v with Merck for the fat-busting nasal spray, and now Merck is in deep doo-doo with the Vioxx recall. I'm just wondering if I should dump it now (at a small profit), or hang on for a bigger one.
-
-
Well short-term a stock can benefit from such news, but in any case, news alone shouldn't be the reason you trade a stock. Often price direction makes no logical sense when compared to the interpretation you have of the news - defies logic, and that's great because it's what makes a market. I say base your entries and exits on strict discipline and plan. What was your plan going into the trade? What rules did you make? Have you followed them? What is your target? Is the plan still valid? If so, move stop to breakeven and be patient. If not, be disciplined and get out. Do you have a stop loss? If not, why not? Consider all these things and get a routine about what you're doing. And above all, remove the factor of emotion, which is the hardest thing to do because as humans we feel great when we win and terrible when we lose, and the emotional rollercoaster one can experience as stock prices jump around can give you an ulcer if you let it.Originally posted by Bruceaholic
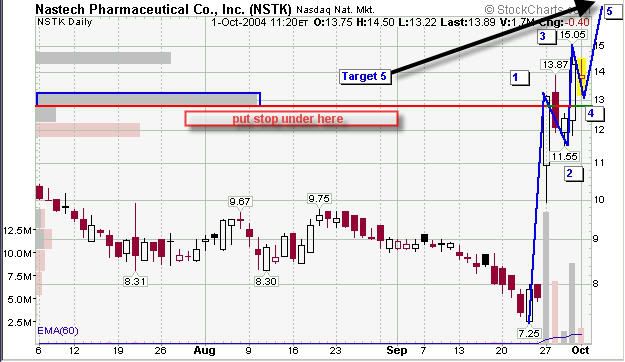
As far as NSTK technically, I'd target wave 5 and put stop under that volume by price line (assuming this is still within your stop loss pain). The fact is, a significant long-term down channel was broken by the recent bullish move, and sets the stock up for a 5 wave move the way it's forming. It happens all the time. Check out 5 wave moves in this thread. It's amazing the movement that follows a stock that experiences what NSTK currently is. Usually a 5 wave move up with powerful intesity will result in a selloff that can last months and retrace to fill gaps - even 100% retracements from where the move started from. The volatility can be huge, and can take stops out and frustrate you. Timing is everything.
Good luck with it!
Here's the chart:
Comment
-
Update:

CDIS stopped. This bullish move opens the door for 38.50 upper channel on daily. Back to watching
CDE and ARIA heading nicely to targets.Comment
-
Like I said, I'm VERY new to this. Thanks for the advice. I'm just looking to make money. LOL I'm trading with money that was "free" so to speak, so if I have gains, wonderful, if I lose it, well, that'll suck, but it wasn't like I lost my own money. Hope that makes sense. But thank you for the advice, and I'm going to print it out and figure out what you've said.Comment
-
Uhal
Thanks for the chart, Spike, I am out with 30% @38, and can't help but think I left some on the table- The PhotonThe PhotonComment
-
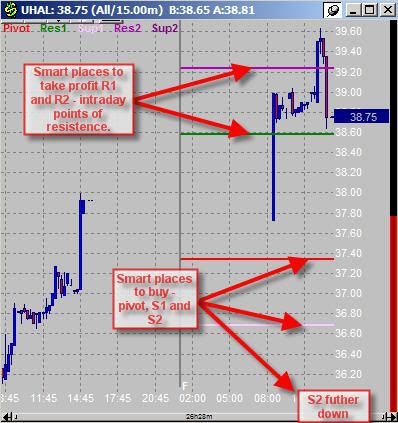
Hey congrats on the trade. If you exited as per your rules then great. Yes, you left some on the table today, but that's OK since nailing tops consistently can't be doneOriginally posted by The Photon As far as the daily exit, yes, I see more upside.
I will say that if you want to exit, make it a logical place on the daily chart AND intraday chart. The daily I've posted - target upper channels. Here is an intraday chart of UHAL today showing where to sell.
Comment
-
Bear shot
Contrary to the predictions of a lower market, today was the day the bear got shot.
found this over at dacharts.com and had a chuckle.
Market finished at HOD and is near very heavy resistence going into the weekend. It'll be interesting to see whether we get a gap on Monday, and whether it'll be up or down. My own TA says further upside next week to the SHS target referenced earlier in this thread, and perhaps beyond.
And yes, I am frustrated at missing the QQQ move by 2 pennies on Tuesday when stopped out below that intraday shoulder! If only I'd used a LOD stop Good weekends all!
Last edited by spikefader; 10-01-2004, 04:36 PM.Comment
-
Entry point for WITS
Spike,
What will be a nice entry point for WITS. I am planning to go long. Can you also comments on short term price movement for AUO.
Thanks in advance for your response.
Regards,Comment
-
Hi stocks54.Originally posted by stocks54
WITS is a great stock to be going long with imo. I've read recently that IIC at these forums is very bullish on it too, and from a technical perspective, it's been strong since my last post on it in this thread, in which I posted this chart: http://img.photobucket.com/albums/v1...ITSbullish.jpg
I'll post some charts later for it, but today on the weekly, it's just had a channel turnup, and is starting to move away from resistence and volume by price at 14.50. Volume has been great over the last month, and it has off the chart upper channels to target. I would feel fairly comfortable buying the open at Monday assuming no gap up, but the patient and wiser buyer will either buy the pivot at 16.75 or S1 at 16.38. But the stop loss placement is the tricky part. Let's break it down:
A logical weekly stop point is 15.09, under the bullish candle, but if you buy the pivot at 16.75, that's a 9.9% stop loss, which is too rich for me. Buying S1 would be better at 7.8%, but still way above the recommended max 4% risk on any single trade. I prefer stops of under 4% - the lower the better. Sub 1% stops are what I aim for. But this means one must be very patient and can miss moves entirely. If it were me, I'd take S1 entry at 16.38 with my stop loss @ 16.14 (under today's LOD) which gives me my 1% OR a nice inverted SHS intraday pattern on a down day next week to take it long, and set a stop under LOD, which would certainly give me a sub 1% risk. I'm fussy and aim for perfect entries and if I don't get them then I'm happy to walk away with several tiny losses and miss the move.
Why use stops on a stock that looks so promising? Well, the market can be brutal and can leave you completely stunned. There are many examples of it happening, the most recent is MRK, although the weekly chart was screaming caution way back in January when the big channel turned down. But sometimes you don't get the warning - it just happens. I don't know what the fundamentals of WITS are, but whatever they are, imagine the worst POSSIBLE news that could hit it, and then where would the stock price go if that happened?
Anyway, didn't mean to be so long-winded. The short answer is buy Monday's pivot or S1 and put a stop at whatever your max pain is, or at the points I suggested. If you miss it Monday, just follow each day and aim for the pivot or S1.Comment
-
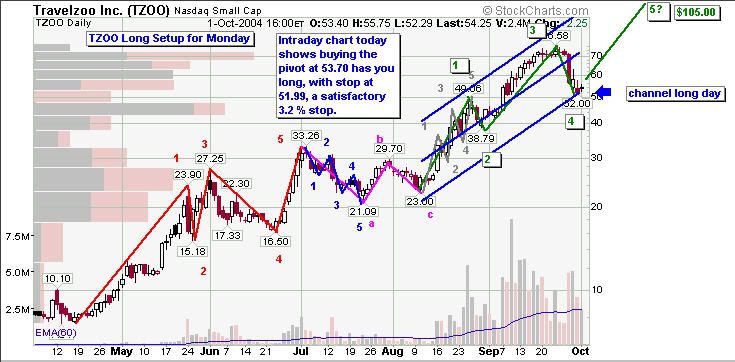
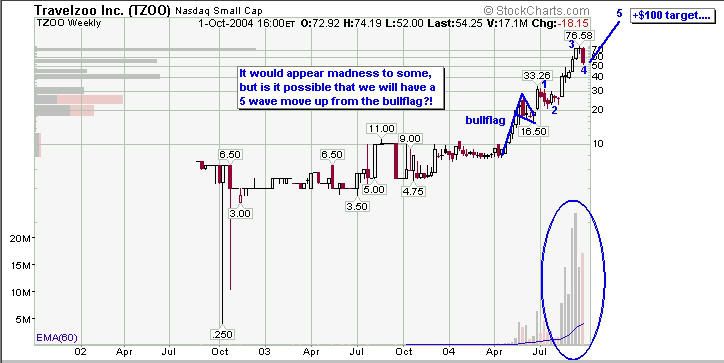
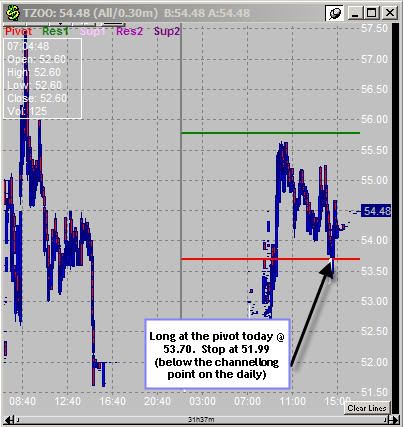
TZOO long setup for next week. Who's game
Probably a fair amount of fear out there regarding TZOO, well we all know where emotion belongs......
Fear not people, it's a very valid and logical long setup. With a fabulous risk reward ratio of 1:30 (risk 3.2% to gain 95.5%). What dreams are made of
Check it out:
Comment
-
ASPM:
Thanks to IIC for spotting the cup with handle formation in his post http://www.mrmarketishuge.com/forum/...postcount=1444
I see it's currently in a bullish ascending triangle formation since July, it's had a bullish weekly channel turnup from the high at 19.67, a weekly channel long last week, a daily channel long just last week, a nice bounce from gap support at 17.44 just this week, and a channel upturn from the recent high at 19.00 just 14 days ago. It's also set to move up and away from lovely volume by price range between 17.00 and where it closed today at 18.25. This is a special people, and looks set to take off. I strongly recommend this one.
Today's S1 was 18.14, and a logical stop would be 17.39 (tucked under Wed low and the gap), and that stop loss is an acceptable 4%. Target is 37.8% to $25.00, so the R/R is 1:9.4, not bad
Don't have time to post the charts, but check it out. Could be a loose-soil gem!Last edited by spikefader; 10-01-2004, 09:16 PM.Comment
-
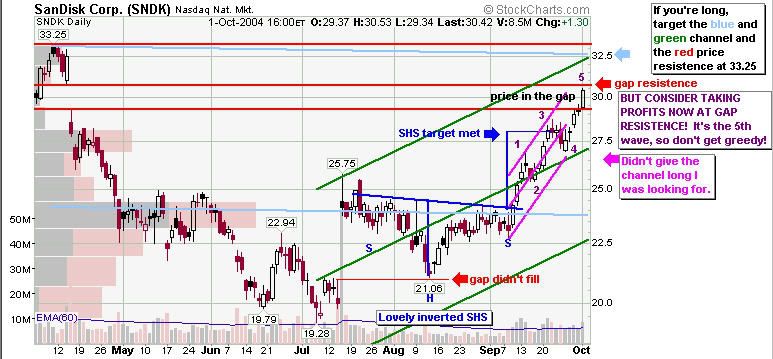
sndk
Keeps runnin up on big volume. Are you bullish yet spike? I picked some up at 28.99, wanted 27 but guess i wasnt patient
thanks
tjkComment
-
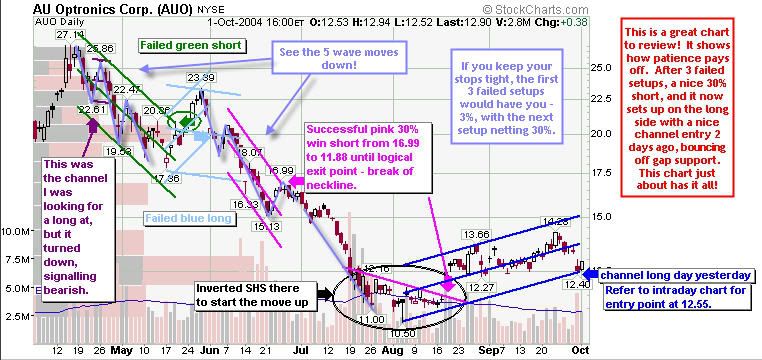
AUO is a really interesting one to review:Originally posted by stocks54
I actually posted a chart for this one back in April, where in hindsight, you can see that the blue wave count was correct and the yellow bullflag occurred in wave 3. http://img.photobucket.com/albums/v1...rading/AUO.jpg
The below chart shows the last 5 months, which has some great wave moves and some frustrating channel behavior. It also shows 3 failed channel setups, followed by 1 rewarding 30% short setup.
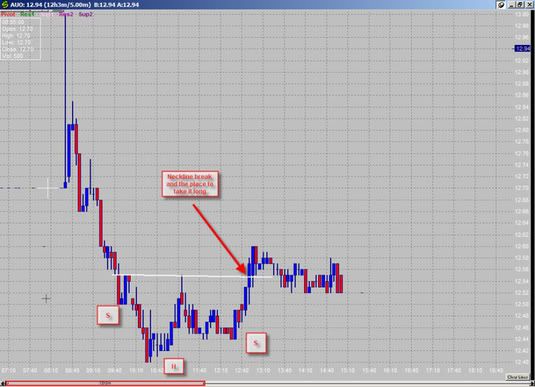
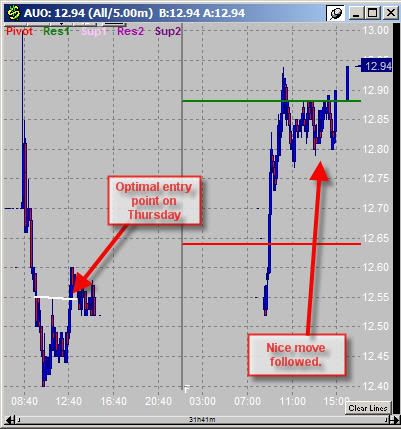
It also shows a current valid bullish setup from yesterday, the daily channel long. Below intraday charts show the inverted SHS and neckline break, showing entry long at 12.55, and very nice move north today.
Comment
-
previous chart: http://img.photobucket.com/albums/v1...SNDKSept26.jpgOriginally posted by tokyojoeskid
I was bullishly looking for the channel entry, if that counts It never gave it to me!
As for today, if I WERE long, I'd be seriously be considering taking profits at the gap resistence of 30.80 next week, and certainly be taking them at 33.25. One can always reenter after it proves it can beat the resistence. Check it out:
Comment


Comment