I have 37 consecutive profitable trades of 15% or better. How is this possible? Every day there are hundreds of stocks setting new highs, no matter what happens in the overall market. Many of these stocks are still at very reasonable valuations. Afraid of buying stocks at their highs? Think of it this way: a new high is really a future floor for companies with solid financial underpinnings. Quantitative momentum modeling makes it easy to identify stocks that can continue this upward momentum trend. Why does this happen? It's really very simple..ask me about what investors and cows have in common. I am $$$ MR. MARKET $$$. I AM HUGE!!! Bring me your finest meats and cheeses. You can join in on the fun. Register for free and you'll be able to post messages on this forum and also receive emails when $$$ MR. MARKET $$$ makes his own trades. ($$$MR. MARKET$$$ is a proprietary investor and does not provide individual financial advice. The stocks mentioned on this forum do not represent individual buy or sell recommendations and should not be viewed as such. Individual investors should consider speaking with a professional investment adviser before making any investment decisions.)
If this is your first visit, be sure to
check out the FAQ by clicking the
link above. You may have to register
before you can post: click the register link above to proceed. To start viewing messages,
select the forum that you want to visit from the selection below.
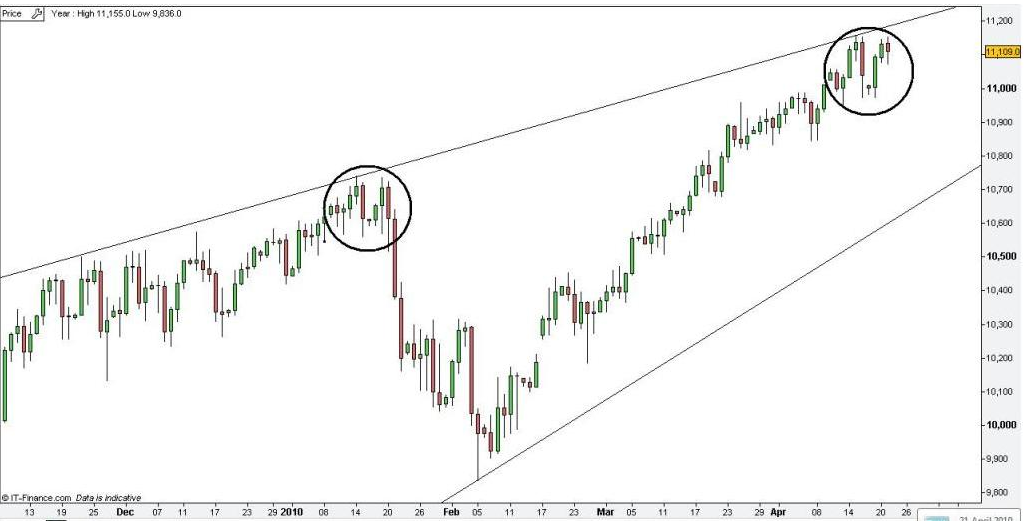
Not bad Billy, I must say it does look like a late stage b/o candidate at this point. I love that double bottom in 2009. I think it's bullish, but I would keep a tight leash on it, probably under the 50 dma.
freestockcharts.com is the most complicated site I've ever seen . It drives me crazy. The same chart has been on there for 6 months and I can't change it. I hate computers!
freestockcharts.com is the most complicated site I've ever seen . It drives me crazy. The same chart has been on there for 6 months and I can't change it. I hate computers!
-----------billy
ahoy billy,
Click on the current chart and just start typing a new ticker symbol....a box should pop up as you type...if you only know part of the symbol the box will list suggestions that includes what you typed, so you can select the correct symbol....
freestockcharts.com is pretty impressive with all you get for free....
No picks since market is pretty overbought and we saw those conditions play out today. I think we do have a short-term top in place. We made a lower high today and then took out yesterday's lows. I think tomorrow will be a good shorting opportunity.
No picks since market is pretty overbought and we saw those conditions play out today. I think we do have a short-term top in place. We made a lower high today and then took out yesterday's lows. I think tomorrow will be a good shorting opportunity.
Well I was wrong there...
Market is just getting whipped right now. This area will be of interest. I'm taking some nimble trades, not over extending myself. Really playing bounces on oversold stocks such as MON.
Haven't posted any stocks cause the market's been too shaky. I think this pull back is a pretty good opportunity as I don't think we've seen the highs for the year. I'll post some charts in a bit of the SPX.
Let's start with the weekly. It's showing that the stochastic's and MACD are rolling over signaling an intermediate term correction of 7-10% which would be about 1050. Arguably we hit it already with the 100 point drop last week.
The daily chart looks like a "dead cat bounce" that is playing out. More downside is likely.
The hourly chart shows a slightly different picture that should be paid attention to. There is a "potential" inverse H&S developing. Look for a break of the trendline for confirmation of further push up.
Market's been tough but this morning was a nice buying op of what I beleive is the start of a short term pop. SHS on the hourly looks promising for bounce..

 Tweet
Tweet


Comment