

 Tweet
Tweet
Originally posted by yaoyao
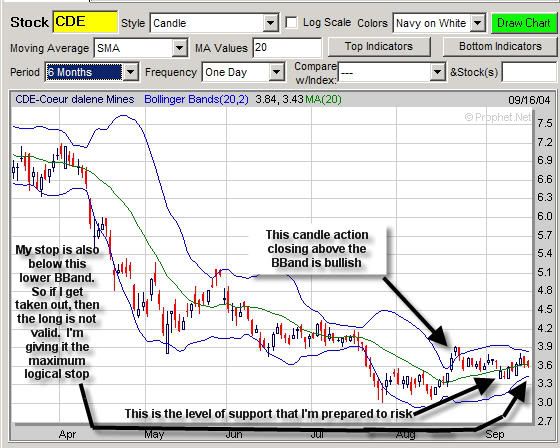
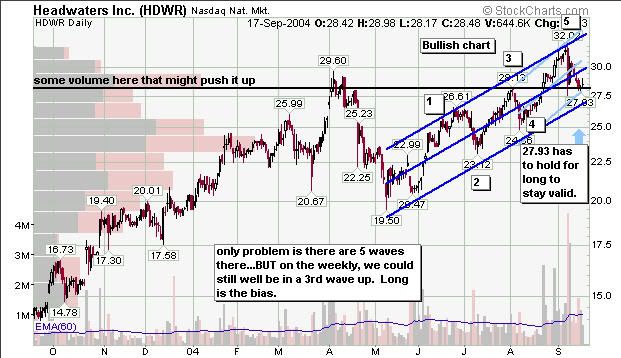
 You are welcome; glad to help. Just remember that the way I use regression channels may differ from how others use them, but I've found that looking for channel touches is effective for spotting potential reversal points, and that if there is a distinct channel expansion (when you're clicking and draging the channel you will see it suddenly expand) caused by price action, then that's effectively a channel break and a warning if you have an open position opposing the direction of the break. If you haven't already opened an 'annotated' chart from stockcharts.com then I recommend it. You'll see what I mean by expansion. It will suddenly get bigger - caused by price ignoring the channel, and forcing it to widen. Once you see that, then that's a channel break. Many times I will open a position long at a lower channel touch day, but at the same time, there is some degree of channel expansion. If my position snagged a good entry, then I'll keep my tight stop, and be cautious with the long because of the channel break. I will definately target profit at the next downward sloping upper channel, since the channel break is a bearish sign. BUT if the downward sloping channel that I would exit my position at actually turns up, then I have a green light to keep the position open.


Comment