

 Tweet
Tweet
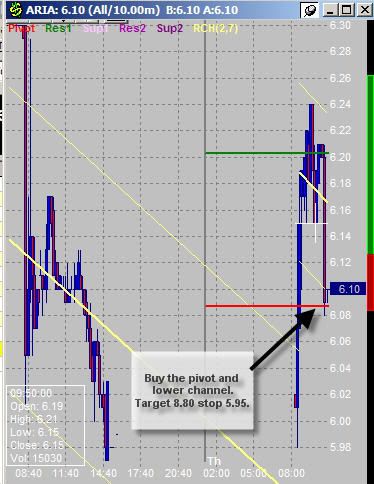
ARIA:
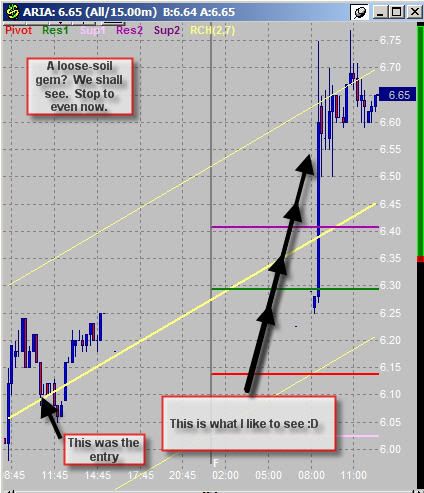
Refer to previus long entry a few posts back. Another nice intraday entry point today; Nice target, great R/R: risking 2.4% for 44% target.
Refer to previus long entry a few posts back. Another nice intraday entry point today; Nice target, great R/R: risking 2.4% for 44% target.


 The Q's frustrate once again - I shall retreat to plot and scheme against it once more mwahaha ...
Comment