I have 36 consecutive profitable trades of 15% or better. How is this possible? Every day there are hundreds of stocks setting new highs, no matter what happens in the overall market. Many of these stocks are still at very reasonable valuations. Afraid of buying stocks at their highs? Think of it this way: a new high is really a future floor for companies with solid financial underpinnings. Quantitative momentum modeling makes it easy to identify stocks that can continue this upward momentum trend. Why does this happen? It's really very simple..ask me about what investors and cows have in common. I am $$$ MR. MARKET $$$. I AM HUGE!!! Bring me your finest meats and cheeses. You can join in on the fun. Register for free and you'll be able to post messages on this forum and also receive emails when $$$ MR. MARKET $$$ makes his own trades. ($$$MR. MARKET$$$ is a proprietary investor and does not provide individual financial advice. The stocks mentioned on this forum do not represent individual buy or sell recommendations and should not be viewed as such. Individual investors should consider speaking with a professional investment adviser before making any investment decisions.)
If this is your first visit, be sure to
check out the FAQ by clicking the
link above. You may have to register
before you can post: click the register link above to proceed. To start viewing messages,
select the forum that you want to visit from the selection below.
Simple indicator of stocks at 1 standard deveation above 200 dma. Notice during entire year stocks were caught in a 7% channel. On 5/11/06 biggest bust of –11.13% and then bust out of channel on 5/12/06 at –12.12%
Good point runner. But do you sell just b/c one index is at resistance? The Naz isn't there yet and the Dow broke resistance. No question that we should be expecting a p/b here since we are in overbought territory.
Good point runner. But do you sell just b/c one index is at resistance? The Naz isn't there yet and the Dow broke resistance. No question that we should be expecting a p/b here since we are in overbought territory.
DMK, no I don't sell but I tell ya what I've done. I tighten my stops on open longs. I posted this caution chart to try to bring things back into perspective, I sense a lot of excitement and when everyone gets all bullish is normally a time when things change. Really other then the DOW I'm not much impressed with this huge mega rally...
Last year around this time the market was being carried which secteor? Yes..ENERGY AND GOLD. What are those sectors doing right now?? Being sold for some time since July time frame or so.... If we had this move in the indexes without those sectors, I think if they can make a come back (and I believe they are going to) we are going to have a continuation of this rally.
Take a look at some oil charts...You will notice that there is a double bottom in place. GOLD doesn't look as good but it looks similar. IF that double bottom holds we can get a significant move in the OILS and this would move the market higher. Then LOOK OUT because that upper channel will break and we will have a huge rally coming our way. Santa Claus rally here we come
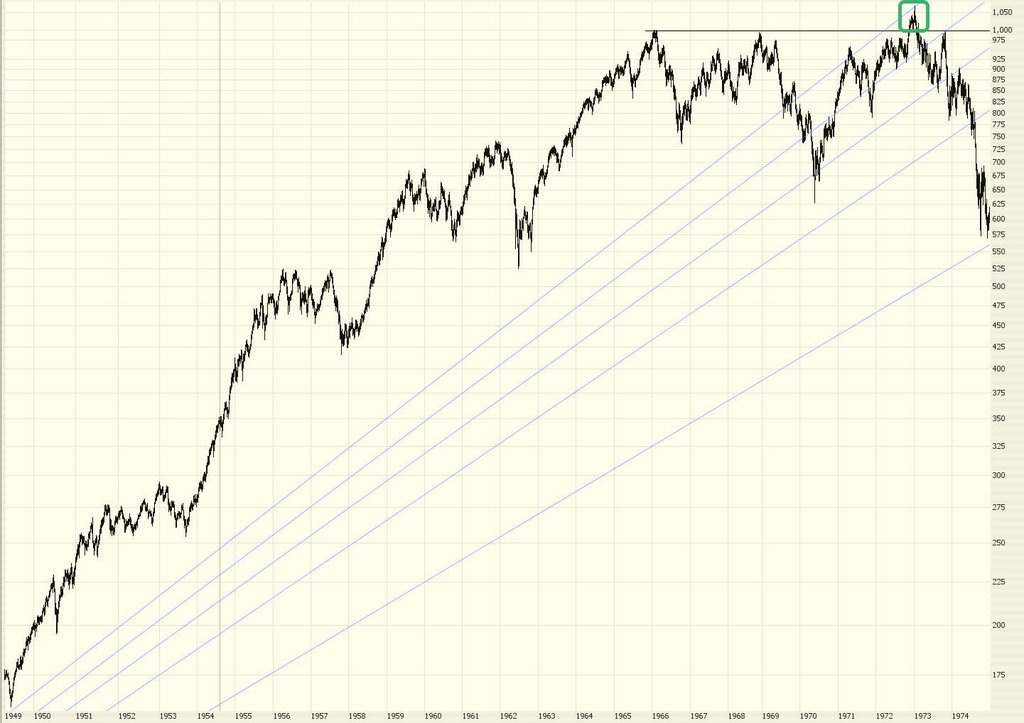
I would say that to indicate improving health in the market we want to see to improving breadth. There is an argument right now that the breadth is narrowing, to the large caps, and this is not bullish for the market for the intermediate to long term. See what happened to the DOW in the early 1970s just after it had finally overcome a previous double-top to reach a new all-time high--it then proceeded to tank. But that was in a time of "guns and butter" Vietnam and soon-to-be entrenched inflation.
I think that the rise in oils, beyond a certain rate of pricing improvement in crude, had been correlated with narrowing breadth in the stock market. That is, the oil tax on the economy results in an economic environment in which only a few companies can do well, and conversely, lowering of the crude price offers the hope that more kinds of business can improve going forward.
Watching the price of gold has always seemed to me to be like watching a dysfunctional person. Granted, the price of gold is a barometer of a *part* of the market's inflation expectations. (Saying "part" here is very important. It is the part that isn't invested in the rest of the economy, where adjustments are made, materials are substituted, etc. to adjust to higher prices.) The "bad news is good for gold" crowd doesn't get it, it seems to me. When economic activity goes bad, there are huge inertia, capital, and aggregate strength of will that will seek to get the economy back on its feet. This is what the dysfunctional gold watchers crowd is betting against, and I say that's almost never a good bet to hold for very long.
Being bullish on gold was a very good call when the Fed put out massive easy money (in response to the deflationary pressures caused by the capital movements into low-wage China and India) to get prices, and later wages, rising again. But beyond that kind of transitional situation, the price of gold moves back into its dysfunctional phase, where good news for the economy can mean that gold rises due to a misinterpreted expectation of inevitable hurtful inflation, which just hasn't turned out to be true since the mid-1990s. This sets gold up for further falls after the market becomes convinced that the U.S. economy has moved into a slower growth phase but short of a recession.
What I find interesting is during this rally in the Dow the lack of DOW-30 stocks making all time highs along with the Index. If fact from the 12/31/99 highs the Dow is currently 3% above those highs. I believe if earnings should not shine during this coming earnings season this market will be toast.
a few other interesting numbers to chew on. 63.3% of the DOW components showed losses of -20% or more from their all-time highs, and 43.3% showed losses of -40% or more. interesting divergence to say the least. Hey enjoy it while it lasts.. I think the excitement may continue for awhile, but like I said earnings better be outstanding or hold on as the landing could be rough..
Don't take me the wrong way as I'm not a bear yet as the trend indicates the direction is pointing up, but I'm a cautious bull at this stage and ready to grab my bear suit when conditions change..
but im going to say im a bear at this point....im not really impressed with this rally ....leading stocks arent there and that isnt a good sign...actually i have counted quite a few distribution days in the DOW, nasdaq, and s&p 500....in the past 4 weeks. im also putting some tight stops on my long positions...should be interesting...
This is what happens when the OILS go up with the market.
Now we are overbought, can't argue there but remeber overbought can become more overbought, so don't look at indicators to keep you out of the market because if you did you are missing a hell of a move.
This is what happens when the OILS go up with the market.
Now we are overbought, can't argue there but remeber overbought can become more overbought, so don't look at indicators to keep you out of the market because if you did you are missing a hell of a move.
Happy trading everyone.
Very wise post
Don't buck the trend
Hide not your talents.
They for use were made.
What's a sundial in the shade?
- Benjamin Franklin
Mechanical Q's system returns since bottom in 05. This chart is not for non techies... I have just learned this system and back testing signals have proven nicely. I'll be looking for signal short when ever this might happen is anyone's guess. Red spikes on top chart indicate oversold and or bottoming action should occur soon.
Mechanical Q's system returns since bottom in 05. This chart is not for non techies... I have just learned this system and back testing signals have proven nicely. I'll be looking for signal short when ever this might happen is anyone's guess. Red spikes on top chart indicate oversold and or bottoming action should occur soon.
Maybe it is just me...but the chart displays as very choppy...Even w/ my new glasses I picked up yesterday I cannot make a lot of it out. Is there any way to post a clearer chart?...thx, Doug
"Trade What Is Happening...Not What You Think Is Gonna Happen"

 Tweet
Tweet


Comment