Top swing trading stock & ETF picks with Morpheus Trading Group (MTG)

Collapse
X
 
  • Filter
  • Time
  • Show
Clear All
new posts
  • morpheustrading
    Senior Member
    • Sep 2012
    • 131

    #31
    Over the past several days, we have been clearly explaining that our current plan of action is to be in “SOH mode” while waiting for the weakest ETFs and stocks to bounce into significant technical resistance levels, such as moving averages and prior lows. Then, we would wait for the bearish reversal patterns as a signal to initiate new short positions (and/or buy inversely correlated “short ETFs”). As such, we were pleased with yesterday’s (lighter volume) relief rally because it puts us closer to getting back into the market with new swing trades, albeit likely on the short side.

    Given yesterday’s large percentage gains, the current bullish momentum could easily cause stocks to move higher for at least another week or two before the bears return to the market, causing the established downtrend to start taking hold again. Nevertheless, it’s important to remember that the stock market is very dynamic. For example, the sudden presence of an “accumulation day” (higher volume gains), followed by a confirmation day in which stocks jump another 1.5% to 2% at least three to four days later, could actually generate a new “buy” signal in our model for market timing. If that happens, no problem; we don’t care either way. Our proven stock trading strategy is based on trading either side of the market by simply reacting to current price action in front of us, rather than making predictions about market direction. Simply put, we always trade what we see, not what we think!

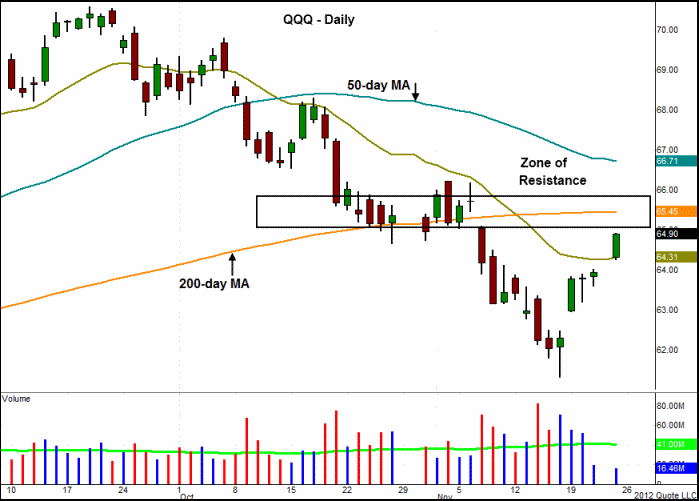
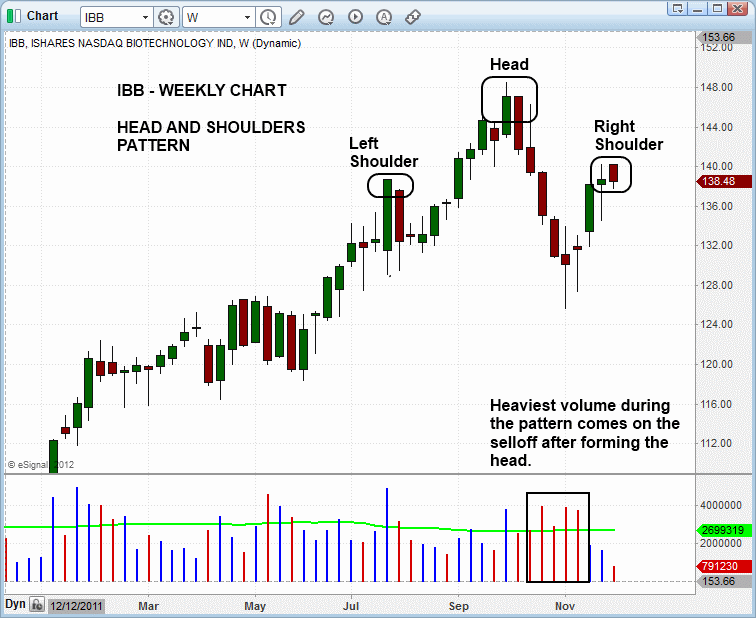
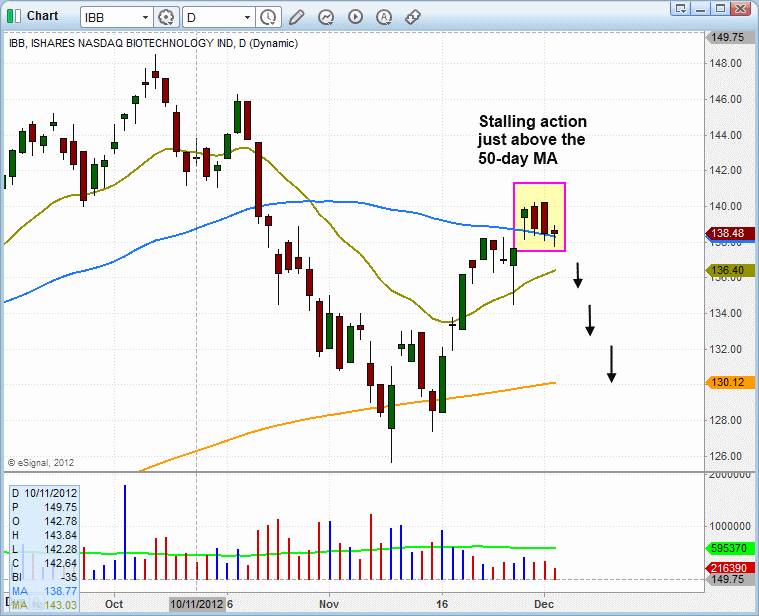
    In yesterday’s newsletter, we said we were looking for pullback re-entry points into our recent winning ETF trades ($SRS, $SMN, $SKF, and $TMF). We also said we were looking for new short entry points in non-inverse ETFs such $IBB and $QQQ. Yesterday’s rally was a good start, as the inverse ETFs we’re stalking for re-entry pulled back substantially, while the non-inverse ETFs conversely bounced sharply higher (approaching resistance). Still, none of these ETFs we have been discussing are near the levels where we would consider entering them just yet. However, we came across one ETF that is already set up for possible short entry in today’s session.

    The SPDR S&P Homebuilders ETF ($XHB) was one of the last ETFs to break down below support during the recent decline, but now the ETF has a lot of immediate overhead supply and resistance to contend with. Just like many other stocks and ETFs, XHB jumped 2% higher yesterday. However, it formed a bearish reversal candlestick (similar to a shooting star candlestick) after running into resistance of both its 20-day exponential moving average and 50-day moving average. The ETF closed near its intraday low, and below both moving averages. This is shown on the daily chart of XHB below:


    The setup for this swing trade is that we will only sell short XHB if it trades below yesterday’s low. This would provide us with a valid short entry point because its current relative weakness would indicate a resumption of downward momentum if that happens. Note that entering before a break of yesterday’s low is risky and not a valid short entry point. We are listing XHB as an “official” setup on our ETF Trading Watchlist today, so regular subscribers of our swing trading newsletter should note our exact, preset trigger, stop, and target prices for this swing trade setup on the short side. By the way, if you are new to short selling stocks, we recommend taking a quick look at this short trading education video, as it provides a general overview of a basic short selling strategy.
    Last edited by morpheustrading; 11-20-2012, 09:00 AM. Reason: typo

    Comment

    • morpheustrading
      Senior Member
      • Sep 2012
      • 131

      #32
      3 ETFs Technically Setting Up For Buy Entry Now ($EEV, $TMF, $SMN)

      One ETF we are stalking for technical swing trading buy entry today is ProShares UltraShort Emerging Markets ETF ($EEV), an inversely correlated short ETF. As you can see on the chart below, EEV broke out above a six-month downtrend last week, and has now pulled back to near-term support of its 20-day exponential moving average, which recently crossed above the 50-day moving average. This is a bullish trend reversal signal. With the ETF moving higher in yesterday’s session, but closing just below the previous day’s (November 19) low, we are now monitoring EEV as a potential short-term trade above the two-day high. Regular subscribers should note our exact entry, stop, and target prices for this short-term momentum trade setup in the ETF Watchlist section of today’s newsletter. The technical trade setup for EEV is shown on the daily chart below:


      Although the main stock market indexes were flat yesterday, there were at least two ETFs we have been monitoring that pulled back to near-term technical support levels. Specifically, they retraced to test or “undercut” their 20-day exponential moving averages. One of those ETFs was Direxion 20-Year Treasury Bull 3x ($TMF), a fixed-income ETF that roughly follows the price of the US long-term treasury bond, but is leveraged at a 3 to 1 ratio. Last week, we sold this ETF for a substantial trading profit, after it broke out above resistance of a four-month downtrend line. However, the ETF has remained on our radar as a potential swing trade re-entry on a pullback. The current pullback that followed the recent breakout above the downtrend line is shown on the daily chart of TMF below:


      As you can see, TMF sold off sharply yesterday, and closed just below near-term technical support of its 20-day exponential moving average. Such a price retracement off its recent highs provides a low-risk re-entry point to buy this ETF. However, remember that we do not blindly try to anticipate where a pullback will end and find support. Rather, we must now wait for the formation of a bullish reversal candlestick within the next several days, then look to buy TMF above the previous day’s high, which would confirm the pullback off the highs has ended, and TMF is likely to resume its bullish trend reversal. Therefore, although TMF is not yet listed on today’s watchlist as an “official” buy entry, it is now on our internal watchlist as a potential technical swing trade setup we are monitoring for the proper trigger point for buy entry.

      Another ETF with a similar pattern is ProShares UltraShort Basic Materials ETF ($SMN), another short ETF. After buying the breakout above its downtrend line, we sold this ETF into strength last week for a 9.2% gain on an 8-day holding period (click here for a quick educational video recap on YouTube of the technical setup of this recent swing trade). Now, it has pulled back to near-term support of its 20-day EMA, but probably needs another day or two to either “undercut” support of the 20-day EMA, or at least form a bullish reversal candle, before we would look for an actual re-entry point into this ETF. Like TMF, this setup in SMN has been added to our internal watchlist as a potential near-term buy entry. The daily chart pattern of SMN is shown below:


      Going into yesterday’s session, we were stalking SPDR S&P Homebuilders ETF ($XHB) as a potential short sale entry if it traded below the November 19 low. However, the ETF opened slightly higher, then rallied to close near the previous day’s high. As such, the ETF did NOT trigger for short sale entry, and has been temporarily removed from our “official” watchlist as a swing trade setup. Whenever we list a swing trading setup that does not hit our trigger price, we don’t care because there is “no harm, no foul” for disciplined traders.

      Comment

      • morpheustrading
        Senior Member
        • Sep 2012
        • 131

        #33
        Why The Nasdaq Still Has A Lot Of Work To Do

        It was obviously positive that stocks continued building on their gains since bouncing off their mid-November lows, and did so on higher volume last Friday. However, it’s still too early to declare an end of the broad market’s multi-month downtrend from its September 2012 highs. One of the biggest reasons we say this is because the main stock market indexes still have an abundance of overhead supply to contend with. Furthermore, several of the major indices are now bumping into, or are quickly approaching, key technical resistance levels. One good example of this can be seen on the daily chart pattern of PowerShares QQQ Trust ($QQQ), a popular ETF proxy for trading the Nasdaq 100 index:


        As you can see, $QQQ broke out above resistance of its 20-day exponential moving average last Friday. However, notice the horizontal price resistance just overhead, which was formed by the prior swing lows from late October, as well as the prior highs from July. Furthermore, the 200-day moving average, which formerly acted as support and now will provide formidable resistance, is less than 1% above the current price of $QQQ. Above that resistance level is the 50-day moving average, which has been sloping lower since mid-October, and is in danger of crossing below the 200-day moving average.

        Whenever a market is trying to form a significant bottom, but has a plethora of overhead resistance levels, it is common for there to be at least one shakeout that tests or “undercuts” the prior low (from November 16), before the index can reset itself and start heading back up. For these reasons, it is still too early to declare the Nasdaq has found a significant bottom.

        Another key broad-based ETF, the iShares Russell 2000 Index ETF ($IWM), has a similar chart pattern to $QQQ. The one difference is that it has already bounced to close right at its 200-day moving average last Friday. Furthermore, $IWM is still trading below the upper channel of its downtrend line from the September 2012 highs (the red line on the chart below), which may be difficult to overcome on the first few attempts. Take a look:


        We’ll be closely monitoring the price action of both $QQQ and $IWM in the coming days, as the ability or inability of these indexes to move back above their 200-day moving averages, horizontal price resistance, and trend channel resistance may determine the tone of the broad market trend for the rest of the year. We focused on these broad-based ETFs, rather than the S&P 500 SPDR ($SPY) and Dow Jones Industrial SPDR ($DIA), because they better represent the performance of leading stocks (solid breakouts of leading individual stocks is a key component of a healthy market). Additionally, $QQQ and $IWM showed the most relative weakness of the broad-based ETFs on the way down, so they have the most technical damage to overcome.

        Although we are still monitoring for new, low-risk entry points for ETF swing trades on the short side (and/or buying inverse ETFs), we can not ignore last Friday’s “accumulation day” (higher volume gains) in the market. Nevertheless, it’s important to realize a market bottom is never a one-day event, so we need to see more evidence accumulate over the next two weeks to confirm that an intermediate-term bottom is in place. Specifically, we need to see convincing breakouts of fresh leadership stocks, while the major indices need to avoid printing a bearish “distribution day” (higher volume loss) over the next five days.

        Comment

        • morpheustrading
          Senior Member
          • Sep 2012
          • 131

          #34
          How To Quickly Find The Best Stocks And Chart Patterns To Buy Now

          As stocks attempt to form a significant bottom since bouncing off their November 16 lows, many traders of stocks and ETFs may now be wondering how to find the best, most bullish chart patterns and stocks to buy now. Specifically, swing traders need to know which technical criteria and types of chart patterns they should be looking for, in order to find the best stocks to buy right now.

          In the short (3 minute) video below, we will answer the question above by showing you a few basic examples of bullish chart patterns you should be looking for as market conditions improve. We will also show you a quick and easy way to screen for stocks and ETFs that meet our technical criteria for these patterns. Ticker symbols discussed in the video include: $AFFY, $LCC, and $AAPL.

          Play video on YouTube by clicking on the following link:

          How To Quickly Find The Best Stocks And Chart Patterns To Buy Now

          Comment

          • morpheustrading
            Senior Member
            • Sep 2012
            • 131

            #35
            Low-risk Swing Trade Setup In This International ETF ($FXI)

            Two weeks ago, in our November 14 ETF commentary, we initially pointed out the relative strength of iShares China Xinhua 25 Index ($FXI) and said, "Although the main stock market indexes of the USA have been in a downtrend since mid-September, FXI actually started trending higher right as the domestic markets started selling off...and is now in pullback mode."

            In our subsequent November 19 ETF analysis, just a few days later, we revisited the chart pattern of $FXI and said that, "very short-term traders only might consider buying FXI if it moves above the November 16 high of $35.88." Because US stocks had not yet confirmed at least a near-term low had been formed, we passed on "officially" adding this trade setup to our ETF Trade Watchlist. Nevertheless, we still pointed out the trade so that more aggressive, very short-term traders could take advantage of an anticipated "quick pop" is the desired. Fast forwarding to the present, take a look at the updated chart of $FXI below:


            Note on the chart the level where we initially said aggressive traders could buy above the two-day high (circled in pink). This was due to the relative strength of FXI, a major level of horizontal price support (the blue line), and convergence of the 50 and 200-day moving averages (teal and orange lines respectively). Thereafter, FXI generally trended higher, but not in a very steady fashion.

            Yesterday (November 2, like most stocks and ETFs in the market, FXI gapped down sharply lower, but reversed to close at its intraday high and back above its 20-day exponential moving average (beige line). This followed a normal four-day pullback from its November 23 high. This has created an ideal pullback buy setup in FXI, which has a positive reward to risk ratio for swing trade entry above yesterday's high. Regular subscribers to our trading newsletter should note our preset, exact entry, stop, and target prices for this swing trade setup.

            Comment

            • morpheustrading
              Senior Member
              • Sep 2012
              • 131

              #36
              Why This Week's Trading Will Set The Tone For Rest Of 2012 ($SPY)

              Since the last two weeks of December are typically dead in terms of trading volume, there are really only two more “tradeable” weeks remaining in 2012. Therefore, it is fair to say the overall price action of the broad market over the next several days could easily set the tone for the remainder of the year. As such, today’s technical trading commentary will focus on a few key factors to monitor this week in order to help determine whether stocks might finish the year with a bang, fizzle, or plunge.

              The potential challenge as we enter the final month of 2012 is that stocks must still contend with an abundance of overhead supply and technical resistance levels. “Overhead supply” is formed by traders who formerly bought near the highs, but did not quickly cut their losses when stocks headed south. Still holding on to these losing positions, these individuals are typically eager to sell into strength of any further broad market gains, simply in the hope of “just breaking even” (learn why hope is a very dangerous emotion for traders). This selling pressure formed by the overhead supply is what makes it difficult for a confirmed down trending market to fully reverse into a new uptrend, at least without a substantial period of correction by time (“back and fill” price action).

              With the Nasdaq and S&P 500 still trading below their September 2012 highs by about 5% and 3% respectively, only a sudden surge in institutional buying (high volume) would enable the broad market to rally all the way to new highs in a short period of time. On the daily chart of S&P 500 SPDR ($SPY), a popular ETF proxy for the benchmark S&P 500 Index, we have annotated the key resistance levels to pay attention to this week:


              Overall, the month of November was basically a scratch. The main stock market indexes printed significant losses in the first half of the month, then reversed to recover those losses in the latter half of the month. In the end, prices were little changed for the month. Despite this, the accurate signals received from our market timing model enabled us to still score decent gains in November by swing trading on both sides of the market (updated stats of our trading profits through November 2012 will soon be posted on “performance” page of our website).

              Our market timing model has been in “buy” mode since November 23, the day it reversed from the previous “sell mode” after receiving signals that a significant market bottom may be forming. We still have two short positions in our model ETF trading portfolio, but the majority weighting of our swing trades (combining ETF and individual stock positions) remains on the long side of the market. Furthermore, if our timing model receives the proper technical signals to shift into a new “confirmed buy” mode, all bets on the short side would be off, and exposure on the long side would also be increased. But for now, maintaining a small percentage allocation of short/bearish exposure may help to reduce overall portfolio risk by basically “hedging” until/unless the downtrend from the September 2012 highs is convincingly reversed by the formation of two “higher lows” and “higher highs” on the daily charts. Trading objectively with a rule-based market timing system removes the guesswork and emotion out of knowing which side of the market to be on, and with how much exposure.

              Going into today’s session, last Friday’s new swing trade setup in iShares Poland Index ($EPOL) remains an “official” buy setup with exactly the same trade parameters (subscribers to our swing trading newsletter should note our exact trigger, stop, and target prices for this ETF trade setup on the Watchlist section above). We continue scanning for new ETF trading opportunities, such as buying the incredibly strong iShares Philippines ($EPHE) on a pullback to support. However, remember the best swing trade setups with a positive reward-risk ratio will eventually come to you. Avoid half-baked swing trading setups just for the sake of being in the action. If action is all you’re looking for, go to Vegas and get your fix. But if you’re serious about consistently raking in short-term trading profits over the long-term, you must develop the patience and discipline to follow our proven swing trading system taught every day in this newsletter.

              Comment

              • morpheustrading
                Senior Member
                • Sep 2012
                • 131

                #37
                Profit From The “Head & Shoulders” Pattern In This Biotech ETF ($IBB)

                In the November 19 issue of our swing trading newsletter, we initially pointed out that iShares Nasdaq Biotechnology ETF ($IBB) may be in the process of forming a bearish “head and shoulders” pattern on its weekly chart. Now, after a month-long bounce off support of its 200-day moving average, $IBB is forming the “right shoulder,” after stalling at resistance of its 50-day moving average the past few days. This is shown on the weekly chart of $IBB below:


                Notice how the recent highs of $IBB over the past few days correspond to the highs of the “left shoulder.” The best quality head and shoulders chart patterns should form with a right shoulder that is equal to or less than the high of the left shoulder. For us, a head and shoulders pattern is no longer valid once the right shoulder extends much beyond the high of the left shoulder.

                Drilling down to the shorter-term daily chart interval below, notice how the volume was heaviest on the decline from the top of the head to the bottom of the right shoulder. Higher volume on the selloff from the top of the head, followed by lighter volume on the bounce that forms the right shoulder, is what we look for to confirm the pattern:


                Based on the weekly and daily chart patterns above, we have officially added $IBB to our watchlist as a potential swing trade setup on the short side. Regular subscribers should note our exact, predefined entry, stop, and target prices in the ETF Trading Watchlist section of today’s newsletter.

                We mentioned recently that the broad market was showing signs of weakness during its current counter-trend rally off the lows, and one major concern is the lack of explosive price action in leadership stocks. If we were to focus only on the chart patterns of the major averages when analyzing the market, we would be missing a big piece of the puzzle, which is market leadership.

                When our rule-based market timing model shifts to a new “buy” mode after a significant correction, our attention always turns to leadership stocks and how well they are breaking out from valid basing patterns. Are leading stocks break out on strong volume and holding up, or are they breaking out and selling off (false breakouts)? This information is critical to our decision making.

                If leadership is strong, we can increase our long exposure, as well as our average share size per trade. But if leadership is weak and the market suffers a few “distribution days” (higher volume declines) over a short period of time, we are then forced to reduce long exposure and look for potential short setups. Though our market timing system is still showing a “buy” signal, we are now seeking the necessary confirmation for it to remain so.

                Comment

                • morpheustrading
                  Senior Member
                  • Sep 2012
                  • 131

                  #38
                  How We Made 11% Gain in 4 Days on $QIHU – Trading Strategy Video

                  In this educational stock trading strategy video, we walk you through the clear, technical criteria that recently prompted us to buy Qihoo 360 Technology Co ($QIHU) for a short-term momentum trade.

                  We point out the basic, objective technical analysis that prompted us to buy $QIHU when we did, and conclude the video by explaining our rationale for selling the stock 4 days later for a quick 11% gain. Overall market timing strategy for our swing trading methodology is also discussed in the video.

                  Press the link below to view the YouTube video:

                  How We Made 11% Gain in 4 Days on $QIHU – Trading Strategy Video

                  Hope you find the video to be informative.

                  Comment

                  • billyjoe
                    Senior Member
                    • Nov 2003
                    • 9014

                    #39
                    morpheus,
                    I'm doing great on FXI (posts #27 and #35) and EPOL. Thanks

                    -------------------billy

                    Comment

                    • skiracer
                      Senior Member
                      • Dec 2004
                      • 6314

                      #40
                      Originally posted by billyjoe View Post
                      morpheus,
                      I'm doing great on FXI (posts #27 and #35) and EPOL. Thanks

                      -------------------billy
                      And to think that for years I tried in vain to turn you guys on to Deron and Morpheus. Remember Skiracer in your will please.
                      THE SKIRACER'S EDGE: MAKE THE EDGE IN YOUR FAVOR

                      Comment

                      • morpheustrading
                        Senior Member
                        • Sep 2012
                        • 131

                        #41
                        re: FXI and EPOL

                        Hey Billy,

                        Yes, they have had nice rallies. Glad they are working out for you. However, just as an FYI, we took profits on both of them by selling on yesterday's (December 13) open. Subscribers of our swing trading newsletter were notified of that plan the night before.

                        Thanks for your feedback on this thread.

                        Deron


                        Originally posted by billyjoe View Post
                        morpheus,
                        I'm doing great on FXI (posts #27 and #35) and EPOL. Thanks

                        -------------------billy

                        Comment

                        • morpheustrading
                          Senior Member
                          • Sep 2012
                          • 131

                          #42
                          Ha ha. Awww, shucks. Thanks for the kind words, Skiracer.

                          Deron

                          Originally posted by skiracer11 View Post
                          And to think that for years I tried in vain to turn you guys on to Deron and Morpheus. Remember Skiracer in your will please.

                          Comment

                          • morpheustrading
                            Senior Member
                            • Sep 2012
                            • 131

                            #43
                            How To Find The Best Daily Stock Picks

                            We just uploaded a short, 3-minute trader education video to our YouTube channel that shows swing traders how to quickly and easily find strong stocks that have been forming a base of price support over the past 4 to 8 weeks and are now poised to breakout to new highs in the coming days. Click the link below to view the video (best viewed in full-screen mode):

                            How To Find The Best Daily Stock Picks

                            Bullish chart patterns discussed in today’s video include: $IMH, $DK, $PHM. Although all the stocks discussed in this video have bullish chart patterns that could push higher in the near-term IF the broad market remains healthy, these are NOT specific swing trade buy recommendations.

                            Comment

                            • morpheustrading
                              Senior Member
                              • Sep 2012
                              • 131

                              #44
                              Why Our Stock Market Timing System Has Shifted To “Neutral” Mode

                              On the close of December 13, our stock market timing system shifted from “buy” to “neutral” mode. This means we now have no firm bias with regard to near to intermediate-term market trend for swing trading.

                              The lack of substantial bullish follow-through in leading individual stocks in recent weeks, the absence of leadership in most ETFs (other than international ETFs), and the bearish pattern on the weekly chart of the S&P 500 Index (below) are all valid reasons to avoid the long side of the market now. Nevertheless, recent price action in the stock market has not yet convincingly confirmed the balance of power has shifted back to the bears, so we are a bit cautious about aggressively jumping in the short side of the market just yet.

                              Below is a longer-term weekly chart pattern of S&P 500 SPDR ($SPY), a popular ETF proxy for trading the benchmark S&P 500 Index. Notice that $SPY will likely print a bearish “shooting star” candlestick pattern for the week. This is a topping pattern that often indicates near-term bullish momentum is running out. Since a weekly chart is a longer-term interval than a daily chart, the formation of this shooting star pattern on the weekly chart is more important than if the the same pattern occurred on a daily chart:


                              Notice that the formation of the shooting star candlestick also occurred as $SPY “overcut” resistance of its downtrend line from the September high. This overcut of the downtrend line is significant because it sucks in new buyers, just as institutions are starting to sell into strength. This creates additional overhead supply that subsequently increases the odds of a resumption of the dominant downtrend. This would be confirmed if $SPY breaks below the horizontal price support shown above, which is merely a move below the low of its current weekly candlestick.

                              Although the weekly pattern of $SPY looks a bit ominous, at least in still trading above technical support of its 20, 50, and 200-day moving averages on the shorter-term daily chart. That’s more than one can say about the Nasdaq 100 Index, which sliced back below its 50 and 200 day moving averages yesterday. As you can see on the daily chart of $QQQ (an ETF proxy that tracks the Nasdaq 100), a break below yesterday’s low would coincide to the Nasdaq sliding back below its 20-day exponential moving average as well:


                              We concluded yesterday’s technical commentary by saying, “Given the lack of explosive price action in leadership stocks and the late day selling in the averages the past two days, the market could be vulnerable to a sell off in the short term…We are not calling the current rally dead, but we do not mind stepping aside for a few days and monitoring the price action.” To coincide with this statement, we made a judgment call to take profits on all long positions in our model trading portfolio by selling at market on yesterday’s open. Given that the broad market subsequently trended lower throughout the entire session, this worked out pretty well. Now, we are back to “flat and happy,” sitting on the sidelines 100% in cash.

                              One big challenge for swing traders right now is that volume levels in the broad market will likely begin heavily receding next week, as we approach the Christmas holiday. As we have warned several times in recent weeks, swing trading in low-volume environments is challenging because day-to-day price action tends to be more erratic and indecisive. Therefore, we’re not in a hurry to enter multiple new positions (either long or short) ahead of the holidays, but will still consider new stock and/or ETF trade entries (possibly on the short side and/or inverse ETFs) with reduced share size if an ideal trade setup with a firmly positive reward-risk ratio presents itself.

                              We do have one new setup to possibly sell short iShares Nasdaq Biotechnology ($IBB) on a slight bounce in today’s session. Review this recent trading blog post to see the bearish setup for $IBB. Our exact, preset entry, stop, and target prices for this swing trade setup are available to regular subscribers of our swing trading newsletter.

                              Comment

                              • morpheustrading
                                Senior Member
                                • Sep 2012
                                • 131

                                #45
                                Why The Countertrend Bounce In The Nasdaq Has Run Its Course ($QQQ)

                                In our most recent ETF trading commentary (previous post in this thread), we pointed out the bearish shooting star candlestick pattern that S&P 500 SPDR ($SPY) formed on its longer-term weekly chart interval. The rest of the major indices closed with the same topping pattern on their weekly charts. Last Friday, we also illustrated the bearish pattern and relative weakness in PowerShares QQQ Trust ($QQQ), a popular ETF for trading the Nasdaq 100 Index. On the updated daily chart below, notice that $QQQ is now trading below its 20, 50, and 200-day moving averages, each of which should now act as resistance on any bounce attempt. The blue horizontal line marks horizontal price support of the recent “swing lows” set earlier this month:


                                As marked by the brown, downward facing arrows, we anticipate that a break of horizontal price support in $QQQ will swiftly lead to a retest of the prior low from mid-November. Why? The reason is simply that the stock market rally off the mid-November lows has technically been nothing more than a countertrend bounce from near-term “oversold” conditions. Now, it looks as though the rally may have already run its course, as $QQQ has run into major resistance of its downtrend line from the September 2012 high. Below is a second daily chart of $QQQ, which clearly illustrates how the ETF reversed after bumping into its multi-month downtrend last week (the red descending line):


                                We recently profited in a few ETF and stock swing trades on the long side after our system for timing the stock market shifted to “buy” mode. Yet, we were still fully aware at the time that the rally off the lows had not yet proven itself to be anything more than a countertrend bounce within the dominant downtrend. This is one of several reasons our market timing system shifted from “buy” to “neutral” mode on December 13, after several major indices formed “shooting stars” on their weekly charts while running into the downtrend lines from their September 2012 highs. Furthermore, if selling pressure in the broad market persists and we receive the necessary signals, the timing model may soon revert back to “sell” mode. We locked in solid profits on the short side of the market (and through inversely correlated “short ETFs”) when our stock market timing system was formerly in “sell” mode throughout most of October and part of November.

                                Going into today, we have “officially” added ProShares UltraShort QQQ ($QID) to our watchlist as a potential ETF to buy for swing trade entry. This inversely correlated ETF that tracks the price action of $QQQ, but moves in the opposite direction. We are looking to buy $QID, rather than sell short $QQQ, because subscribers with non-marginable cash accounts are unable to initiate short positions, but are not restricted from buying “short ETFs” such as $QID. Also, even though it is leveraged, $QID has shown only fractional underperformance to its underlying index for short-term trading.

                                Our short setup in iShares Nasdaq Biotechnology Index ($IBB) remains on our watchlist as a candidate for potential swing trade short sale entry going into today (December 17). Regular subscribers of our swing trading newsletter should note our clear, predefined trigger, stop, and target prices for the $QQQ and $IBB trade setups in the ETF Trading Watchlist section of today’s report. Also, if you are new to our ETF and stock short selling strategy, be sure to check out this article on our trading blog for a good primer on how we enter new short positions.

                                As for the long side of the market, many international ETFs continue to show clear relative strength and bullish price divergence to the US markets. A handful of these ETFs even closed at fresh 52-week highs last Friday. We recently profited from the sale of two ETF swing trades on the long side of the market, $FXI (China) and $EPOL (Poland), and we continue to monitor select international ETFs for potential buy entry on a pullback. When emerging markets ETFs start forming price retracements that present positive reward to risk ratios for buy entry, we will highlight and bring to your attention some of the better-looking charts for possible buy entry. But other than international ETFs, there are practically no industry sector or other domestic ETFs on the long side of the market to get excited about.

                                Comment

                                Working...
                                X