Top swing trading stock & ETF picks with Morpheus Trading Group (MTG)

Collapse
X
 
  • Filter
  • Time
  • Show
Clear All
new posts
  • morpheustrading
    Senior Member
    • Sep 2012
    • 131

    #61
    Why We Don’t Care If The Stock Market Is “Overbought” ($QQQ, $SPY, $DIA)

    When a stock market is in runaway uptrend mode and refuses to pull back substantially, most investors and traders think, “I am not buying stocks at this level; I’ll just wait for a pullback.” Eventually that pullback will come, but often only after a multi-month advance has passed. This is why, in strongly uptrending markets, we find it much easier and more profitable to focus on the price action and technical patterns of individual leadership stocks and ETFs, rather than paying much attention to whether or not the charts of the S&P, Nasdaq, and Dow are “overbought” (we hate that useless term).

    As long as there remains institutional rotation among leading stocks, with new breakouts continually emerging, the broad market will continue to push higher (although the major averages must also avoid significant distribution). That’s why “overbought” markets often become even more “overbought” than traders would expect before eventually entering into a substantial correction.

    We are trend traders, so we simply follow the dominant trend as long as it remains intact. When the trend eventually reverses, our rule-based stock market timing system will prompt us to exit long positions and/or start selling short…and that’s just fine by us. We are equally content trading on either side of the market because being objective and as emotionless as possible is a key element of successful swing trading.

    The majority of ETF positions presently in the Model ETF Portfolio of our end-of-day trading newsletter are international ETFs because they continue to show the most relative strength (compared to other ETFs in the domestic market). One of our open positions, Global X FTSE Colombia 20 ($GXG), has not yet moved much from our original buy entry point, but we like the current price action:


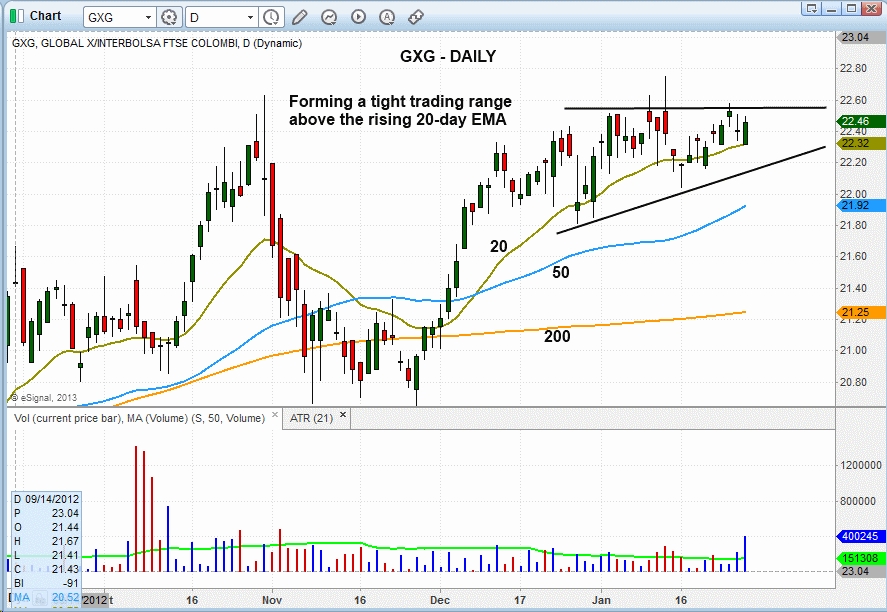
    Since undergoing a false breakout on January 15, $GXG has pulled back to and held support of the 20-day exponential moving average (beige line on the chart above). In the process, it also formed a higher “swing low,” which is bullish. Notice that the price has also tightened up nicely since mid-December of 2012.

    All of this means $GXG could finally be ready to break out above the $22.60 area. If it does, we plan to add to our existing position in The Wagner Daily swing trade newsletter. Regular subscribers should note our exact buy trigger and adjusted stop price for the additional shares of $GXG in the ETF Watchlist section of today’s report.

    While on the theme of international ETFs, let’s take an updated look at the technical chart pattern of the diversified iShares MSCI Emerging Markets Index ($EEM), which we initially mentioned last week as a potential buy setup if it made a higher “swing low” and held support of its 20-day exponential moving average:


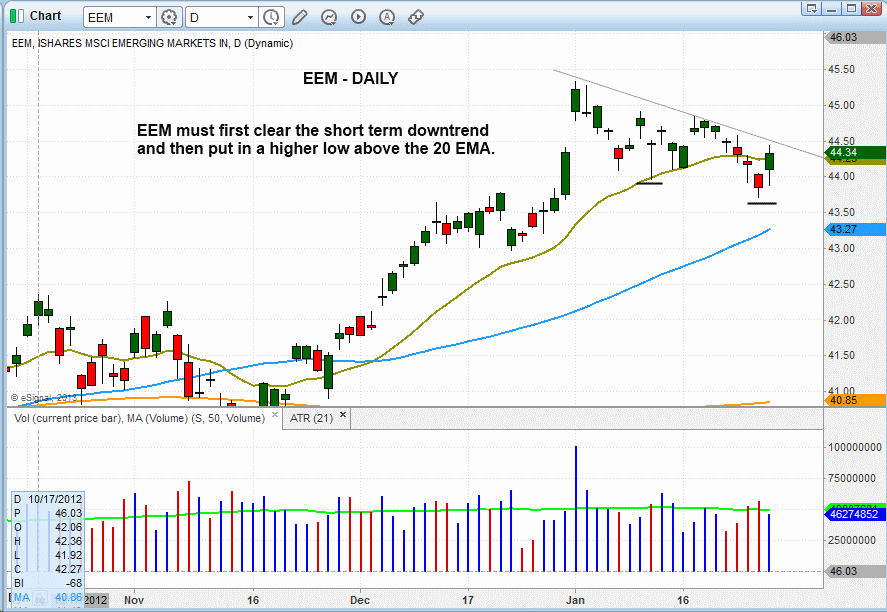
    Although the price of $EEM did not hold above the 20-day EMA, a quick dip (“undercut”) below that moving average, followed by a quick recovery back above it, would keep this bullish setup intact. Therefore, if $EEM can rally above the short-term downtrend line annotated on the chart above, and subsequently put in a “higher low,” we might be able to grab a low-risk buy entry point as early as next week. As always, we will keep subscribers updated if any action is taken on $EEM, or any other ETF with a buyable chart pattern that crosses our radar screen while doing our extensive nightly stock scanning.

    Comment

    • morpheustrading
      Senior Member
      • Sep 2012
      • 131

      #62
      Top 2 Reasons We Don’t Fight The Stock Market’s Trend (Trading Psychology Tip)

      In the January 30 article we published here on this thread (see above), we touched on a key psychological element of how to make consistent trading profits. Specifically, the article addressed the importance of trend trading in the same direction as the overall market trend, and continuing trading on that side of the trend as long as the trend continues.

      Then, in our trading blog one day later, we stressed why the most profitable swing traders are those who learn to merely react to the market's price action that is presented to them at any give time, rather than those who attempt to predict the direction of the next move. The substantial broad market rally that came last Friday, which closed out the week on a high note, perfectly confirmed the trader psychology lessons of our previous two posts.

      When stocks sold off on higher volume ("distribution") last Thursday, January 31, the weak price action was sure to attract some short sellers who keep trying to catch a top, despite the fact the uptrend remains intact. Traders who went ahead and sold short that day quickly got caught with their hands in the cookie jar the following day, as the main stock market indexes gapped about 1% higher on the open and held up throughout the entire day.

      If you are new to our short to intermediate-term momentum trading system, please be assured we have no problems selling short when our proprietary market timing system indicates the dominant trend has reversed. There were several months just last year when we profited on the short side. However, we simply do not sell short against the prevailing trend when there is a clear and objective "buy" signal in place.

      Top 2 Reasons We Don't Fight The Trend
      1. We'll be really honest with you here. Trying to call a top by entering new short positions when the market is still in a firm technical uptrend is something we have tried to do in the past. Upon doing so, we learned that it hardly ever works. Even in the times when we eventually got it right, it was always after several initial failed attempts, which usually led to a net wash (breakeven result) at best.
      2. Perhaps more important than the actual losses sustained from those failed countertrend short selling attempts was the psychological damage done, as it was (and always is) emotionally draining to fight a clearly established trend. It's a bit like trying to swim directly back to shore while stuck in a rip current, rather than swim parallel to the beach until the rip dissipates. Overall, you must realize there is nothing more important to your long-term trading success than protecting capital and preserving confidence. Weakness or lack of discipline in either of these two areas will eventually prevent you from living to trade another day.


      All these powerful tidbits of knowledge, and many other psychological trading lessons we've learned over the past 11 years, are regularly shared with subscribers of The Wagner Daily end-of-day trading newsletter, and we we proudly display the cumulative trading performance results of our long-term efforts to prove it (Q4 of 2012 will be updated this week).

      Moving on from the area of trading psychology lessons, let's look at the current technical situation of the benchmark SPDR S&P 500 Index ETF ($SPY), as we ask ourselves, "Can a market continue to rally while in overbought territory?" Since pictures are always more powerful than words, just take a look at the following daily chart of $SPY from the year 2007. Specifically, notice how the ETF held very short-term support of its 10-day moving average for several months before eventually entering into a correction.


      Note the tight price range throughout the rally, which kept finding support at the rising 10-day moving average on the way up, after pulling back slightly for just 2 to 3 days. There are hundreds of other charts over the years in which we could show the same thing. Therefore, the answer is clearly "yes"...an overbought market can continue to run even higher without a deep pullback. Nevertheless, we are not implying the current market rally will match the chart above, in terms of the percentage gain or length of time, as every market rally is unique. Still, this chart simply serves as a guide and reminder for what could and frequently happens in "overbought" (we use the term quite loosely) markets.

      Although Friday's action was bullish, and we now have solid unrealized gains in the open ETF and stock swing trade positions in our model portfolio, we continue to trail tight stops in order to reduce risk and lock in gains whenever possible. As regular subscribers should note on the "Open Positions" section of today's report, many protective stops have now placed below their respective 20-day exponential moving average, which should provide near-term support during any pullback in the market.

      Comment

      • morpheustrading
        Senior Member
        • Sep 2012
        • 131

        #63
        MTG Stock Screener - New features and tweaks

        A few days ago, we added several new features and tweaks to the (free) MTG Stock Screener, an online technical stock scanner designed to quickly and easily find stocks and ETFs with the highest relative strength that are setting up for ideal swing trade entry points. New features include:

        * New auto-switching between daily and weekly candlestick bars
        * New export capability for individually selected stocks and ETFs
        * Ability to select an individual ticker symbol while looking at the stock charts
        * Improved search capabilities

        For a quick visual overview of the new improvements to the functionality of our screener, check out the 5-minute video on YouTube below. For best quality, view in HD and "full screen" mode by clicking the icon on the bottom right of the video player window:

        Video - New Features and Tweaks - MTG Stock Screener

        As always, just drop me a line here in this thread if you have any questions. Enjoy.

        Comment

        • morpheustrading
          Senior Member
          • Sep 2012
          • 131

          #64
          Why We Are Stalking This Shipping ETF For Pullback Buy Entry ($SEA)

          After breaking out from a tight, seven-month long base of consolidation, the Guggenheim Shipping ETF ($SEA) has pulled back over the past few weeks to near-term support of its 20-day exponential moving average. The longer-term weekly chart below details the prior base of consolidation from which $SEA broke out above (around $16):


          Drilling down to the daily chart interval below, we see the 50-day moving average (teal line) now trading above the 200-day moving average (orange line), and both indicators are moving higher. This is a bullish trend reversal signal. Furthermore, notice how the orderly pullback from the recent highs has enabled the price to find support at its 20-day exponential moving average (beige line):


          The breakout above resistance on the weekly chart, combined with the pullback on the daily chart, provides for a positive reward-risk ratio for this ETF trade setup. As such, we are stalking $SEA for potential swing trade entry going into today’s session. Regular subscribers of The Wagner Daily newsletter should note our exact trigger, stop, and target prices for this trade in the ETF Watchlist section.

          We have seen some institutional sector rotation lately, with a few strong stocks and ETFs pulling back sharply over the past few days ($EWI, $EWP, and $FXI are a few such ETFs). But overall, leadership stocks have held up well and the market has been quite resilient in fighting off distribution (higher volume selling). Although we continue to see the number of new, low-risk buy setups drying up, that is be expected at some point because many stocks and ETFs were rather extended from the January rally.

          Comment

          • morpheustrading
            Senior Member
            • Sep 2012
            • 131

            #65
            Why We Are Stalking This Shiny Solar ETF ($TAN)

            Solar energy stocks have made a comeback over the past few months, with First Solar ($FSLR) leading the way. SolarCity ($SCTY), MEMC Electronic Materials ($WFR), and JinkoSolar Holding ($JKS) have been exploding higher as well. The Guggenheim Solar ETF ($TAN), which is heavily weighted in leading solar stocks from the United States and China, has also been shaping up nicely and may provide us with an ideal technical buy entry point within the next few days.

            $TAN recently reversed a long-term (multi-year) downtrend, and the ETF is now beginning to show classic signs of a bullish trend reversal. On the weekly chart of $TAN below, notice the 10-week moving average crossed above the 40-week moving average two weeks ago. This moving average crossover is a bullish technical signal that signals a reversal of the dominant trend:


            Zooming in to the shorter-term daily chart interval below, we see that $TAN broke out above a month-long base of consolidation yesterday (February 13), but closed near its intraday low. If $TAN now turns into a false breakout by pulling back over the next three to five days, we may be able to grab a low-risk swing trade buy entry as the ETF retraces to near-term support of its rising 20-day exponential moving average, around the $18.40 – $18.50 level:


            The false breakout entry is low-risk because traders who buy the breakout are quickly forced to sell, which absorbs overhead supply. Accordingly, the next breakout attempt has higher odds of succeeding and following through to the upside. Furthermore, false breakout entries enable short-term swing traders to have a clearly defined stop price below the low of the pullback, which creates a very positive reward-risk ratio for the setup.

            If the next move of $TAN is to drift back down into its previous range (false breakout), we will add it to our “official” watchlist as an actionable momentum trade buy setup. As always, regular subscribers of our swing trading newsletter will be notified in advance of our predetermined entry, stop, and target prices for the $TAN swing trade if it meets our strict, rule-based criteria for buy entry.

            Comment

            • morpheustrading
              Senior Member
              • Sep 2012
              • 131

              #66
              How We Gained 11% Over 2 Weeks With $LNKD (Trading Education)

              Last month, we netted an 11% gain on a swing trade in LinkedIn Corp ($LNKD), which we held for approximately two weeks (15 trading days). In this trading education article, we explain exactly how we did it by reviewing the annotated technical chart pattern that prompted us to enter the trade, then concluding by explaining the technical criteria that told us it was time to sell and lock in the profit on this stock pick.

              For all our stock and ETF trade entries on the long side (other than trend reversal plays), we must first verify there is already a well defined uptrend in place before buying. This ensures that bullish intermediate-term momentum is in our favor, which dramatically increases the odds of a profitable trade.

              Although the stock pulled back from a high of $125 in September of 2012 to a low of $95 in November, $LNKD had already rallied more than 100% during a preceding ten-month advance. As such, the $30 price retracement off the September high equated to just a 24% pullback (which is about the maximum percentage pullback we like to see).

              Once we establish that the stock is already in a strong uptrend (here is how we specifically do that), we then look for a bullish base of consolidation to form over at least the next five to seven weeks. $LNKD did exactly that, as it formed a 15-week base from September through December of last year.

              The next step before attempting to establish a low-risk buy entry in a stock that is basing out is to ensure the price action has begun to show signs that bullish momentum has moved back in our favor. This is accomplished by looking for the formation of at least one “higher low” to form within the base.

              As annotated on the first chart below, notice that $LNKD formed a higher low in late November of last year, as it held above the $105 level. Once that higher low is in place, we then start to look for an ideal buy entry point (if one develops).

              On January 8, after four weeks of consolidation above near-term support of its 20-day exponential moving average, $LNKD closed well off its low of the day, after “undercutting” its prior low from January 2. This presented us with a a low-risk entry buy entry point above the $113 level (which was simply a rally above the intraday high of January .

              That night, we provided our exact and predefined entry, stop, and target prices to subscribers of our end-of-day trading newsletter. The following morning, $LNKD triggered our buy entry by rallying above $113. Below is a snapshot of the daily chart pattern as it looked the day before our swing trade buy entry:


              Our preset buy stop triggered on the morning of January 9, and we were long at an entry price of $113.30. Our initial goal with this short-term stock pick was to hold $LNKD for a quick pop, and then sell into strength ahead of its upcoming quarterly earnings report. The momentum of the swing trade immediately began working in our favor, as $LNKD gapped sharply higher on January 10, just one day after our buy entry point, and held firm.

              The strong breakout of January 10 was accompanied by a burst of volume, which attracted plenty of additional buying interest. As such, $LNKD continued pushing higher over the next two weeks. After two strong up days that came two weeks after our entry point, we decided to raise our protective stop after the close of January 28 to just below the $126 level.

              The tight trailing stop we set allowed us to still participate in further upside gains if $LNKD continued moving higher, but also protected nearly all our profit in case the stock took a breather and its price reversed. The next morning (January 29), $LNKD triggered our stop just below the $126 level, enabling us to lock in a solid 11% gain on a 15-day momentum trade hold ahead of earnings. The price action subsequent to our entry point, as well as our eventual exit, is detailed on the chart below:


              Obviously, not all trades are winners that work as smoothly as this $LNKD trade. However, that’s why we always set predetermined protective stops immediately at the time of entry. This ensures that our losses are limited if the trade does not move as anticipated. To be a consistently profitable trader, one only needs to make sure the winning trades are larger than the losing trades.

              Over the course of the 11 years we have been publishing our stock newsletter, we have always aimed for a reward to risk ratio of at least 2 to 1 for each trade setup (meaning the average winning trade is twice the size of the average losing trade). When using strict money management rules such as this, one can still generate consistently profitable long-term returns, even if the winning percentage of overall stock picking is not very high.

              We hope you learned a few new things from this article, as we really enjoy sharing our proven, rule-based stock trading strategy with individuals who are serious about learning trading.

              Comment

              • morpheustrading
                Senior Member
                • Sep 2012
                • 131

                #67
                Top 2 Trading Tips For A Stock Market That May Be Topping

                For the second day in a row, the American broad market sold off across the board on higher volume. Although the percent losses were not as bad as Wednesday, the S&P 500 followed through to the downside for the first time in 2013. With turnover increasing on the both the Nasdaq and NYSE, the S&P 500 and Nasdaq have posted back to back distribution days.

                Whenever distribution begins to cluster, we take notice. Although we never care whether or not stocks are “overbought,” the increasing presence of institutional selling is indeed one of the most important factors we use when assessing the health of a rally.

                Given the sudden reversal in market sentiment over the past two days, this is the perfect time to share with momentum swing traders our top 2 tips for managing your trading account in a stock market that may be forming a top:
                1. Be sure you know and are on aggressive mental defense against these 4 most dangerous psychological emotions for stock traders (greed, fear, hope, and regret). In particular, given the sharp losses of the past two days, traders absolutely must be on alert for the natural human emotion of paralyzing fear that may prevent you from simply cutting your losses on any losing trades that have already hit your stop prices. To ignore your predetermined stop losses is always tantamount to playing Russian roulette with your trading account. But this is even more so the case right now, as the recent rally is beginning to show valid technical signals of a potential top.
                2. In case you missed most or all of the rally of the past two months, perhaps because you didn’t believe in it for whatever reason, you are now probably feeling the pain of regret. If this is the case, you must be very careful to avoid being a “late to the party Charlie” (LTPC) right now (explanation of that term here). While the stock market’s current pullback may indeed turn out to be a low-risk buying opportunity, it is dangerous and way too early to make that determination right now. Continue reading to learn why…

                As far as the charts of the major averages go, the S&P 500, small-cap Russell 2000, and S&P Midcap 400 appear to be in decent shape. The same can not be said of the Nasdaq Composite, which has taken a beating the past two sessions, and is already closing in on intermediate-term support of its 50-day moving average. The Nasdaq 100 Index, which basically did not budge during the entire rally in the rest of the broad market, is already trading below key support of its 50-day MA.

                Looking at the daily chart of the S&P 500 below, it appears the price may be headed for an “undercut” of the prior swing low, around the 1,494 area:


                If and when the S&P attempts to bounce from its current level, the subsequent price and volume action that immediately follows any recovery attempt will be extremely important at determining whether stocks are merely take a breather, or if the rally is dead.

                Next week’s price action in the S&P is important because there is a cluster of technical price resistance around the 1,515 to 1,520 area (annotated by the black rectangle on the chart above). Four sessions of stalling action last week created overhead supply around 1,520, while the 1,515 level represents resistance of a 50% Fibonacci retracement (based on the range from the February 20 high down to the February 21 low).

                If the S&P 500 generates another distribution day that follows just a feeble, light volume bounce off the current lows, that could be the nail in the coffin for the current rally. Still, unless leadership stocks suddenly begin breaking down en masse, a pullback to the 50-day moving average of the S&P 500 would be considered normal within the context of the strong rally of the past two months.

                As we closely monitor price and volume action of the broad market over the next week, we will gain a much better idea as to the likely direction of the stock market’s next major move, which will automatically cause our rule-based stock market timing system (details here) to be adjusted accordingly. But in the meantime, be sure to read the two articles mentioned above so that you will be on guard against the most dangerous emotions that could seriously harm your trading account right now, while also avoiding becoming a member of the “late to the party Charlie” club.

                Comment

                • morpheustrading
                  Senior Member
                  • Sep 2012
                  • 131

                  #68
                  How To Profit From The New Sell Signal In The Market (Short Sell $QQQ)

                  In our February 22 post (see above), which was published immediately following two days of heavy selling on February 20 and 21, we said, “If and when the S&P attempts to bounce from its current level, the subsequent price and volume action that immediately follows any recovery attempt will be extremely important at determining whether stocks are merely take a breather, or if the rally is dead…If the S&P 500 generates another distribution day that follows just a feeble, light volume bounce off the current lows, that could be the nail in the coffin for the current rally.

                  The scenario highlighted in bold text above is exactly what has happened over the past two days. After just a one-day lighter volume bounce last Friday, stocks again got slammed on higher volume yesterday (February 25). Since the S&P 500 Index has now logged three distribution days within the past four sessions, and individual leadership stocks have begun to falter, we are now selectively targeting new stocks and ETFs for potential short sale entry.

                  Even though we have been trading exclusively on the long side of the market since the new buy signal was received at the start of 2013, we are objective, emotionless trend traders who simply follow and trade in the same direction as the dominant market trend (which now favors the downside, at least in the near-term).

                  The PowerShares Nasdaq 100 ETF ($QQQ) closed below support of its 50-day MA yesterday, with an ugly, wide-ranged reversal candle (all the major indices formed bearish engulfing candlestick patterns yesterday). Although support of the 200-day moving average of $QQQ is not far below its current price, prices can slice through important moving averages like a hot knife through butter whenever the market is in distribution mode. Moving averages work really well in a bull market, but not so much when conditions turn sour. The ugly pattern in $QQQ is shown on the daily chart below:


                  The recent relative weakness of $QQQ really becomes clear when comparing its price action throughout last rally with the S&P 500 SPDR ($SPY): On the chart below, notice that the S&P easily cleared its prior highs, but $QQQ struggled with its initial swing high from December 19 (attributed in no small part to the sharp correction in Apple ($AAPL) recently):


                  Operating with the idea that the 200-day moving average of $QQQ will not provide significant support, we now expect $QQQ to fall to test its prior swing low (around the $63 to $64 area) over the next two weeks. As such, we are now targeting this trade as an “official” momentum swing trade setup on today’s watchlist.

                  Rather than short selling $QQQ, we plan to buy the inversely correlated and leveraged ProShares UltraShort QQQ ($QID) instead. This enables our subscribers with non-marginable cash accounts (such as IRAs) to still take advantage of newfound bearish momentum in the market, without technically selling short (inverse ETFs move in opposite direction of the underlying index). As always, our exact entry, stop, and target prices for the $QID trade setup should be noted in the ETF Watchlist section of today’s report above.

                  In closing, the daily chart of the benchmark S&P 500 Index below shows that it’s always a negative technical signal when distribution days cluster over a very short period of time:


                  Numerous times in the past, a cluster of distribution days after an extended rally, combined with the suddenly poor performance of individual leadership stocks, has been enough to prompt us to exit long positions within just a few percent of a market top (check out an actual such example from mid-2012). This has once again been the case, as we have exited all long stock positions (mostly substantial winners), and nearly all of our ETF positions (a handful of small losers) over the past few days.

                  Overall, we had a positive, profitable run from the rally of the past two months (exact statistics to be reported soon), and now are focused on preserving those gains through the combination of sitting patiently in cash, combined with selective short selling of stocks and ETFs with relative weakness.

                  Comment

                  • morpheustrading
                    Senior Member
                    • Sep 2012
                    • 131

                    #69
                    How Market Timing Helps You Stay Calm In Volatile Stock Markets

                    Since February 25, we have been operating on a “sell” signal that was generated by our rule-based market timing system (learn exactly what that means). We have been using that same market timing strategy internally since 2006, and it has always done a pretty good job of keeping us in line with the intermediate-term trend of the broad market, which is where we operate with our short to intermediate-term swing trading system.

                    Although stocks have actually moved slightly higher since our most recent sell signal was triggered, it’s important to understand the market does not always need to immediately break down in order for the timing model to have value.

                    Sometimes a sell signal is generated and the market immediately rolls over, but other stock market timing sell signals lead to an initial short-term bounce before the market moves substantially lower.

                    Obviously, we can never know in advance what will happen immediately following a new sell signal. Still, we always respect a bearish market timing signal by moving to cash and/or tightening up stops on long positions and waiting for conditions to improve before establishing new long positions. A new sell signal also allows us to selectively short sell stocks and ETFs with relative weakness.

                    To clearly illustrate the different ways a market can behave after receiving a sell signal from our market timing model, the charts below detail the subsequent price action of two different intermediate-term sell signals that were generated by our market timing strategy in 2012:


                    After a decent rally in early 2012, the distribution days began piling up in late April and early May, forcing us out of several long positions by May 3 and generating a 100% sell signal on the close of May 4 (as annotated on the chart above). In this case, the timing of the signal was perfect, as the market plunged 7% over the next 10 sessions.

                    Following a very short-lived rally in August/September of 2012, the number of distribution days once again began increasing within a short period of time, and leading individual stocks began falling apart as well. These are two of the main components (along with a few proprietary tweaks) that determine when our market timing model issues a new sell signal.

                    Given the bearish action described above, our market timing strategy generated a sell signal on the close of October 12, 2012. But although this prompted us to quickly exit our long positions, this time the stock market did not immediately come unglued.

                    Instead, there was a short-lived bounce that inevitably attracted some “late to the party” Charlies who were not paying attention to the bearish volume patterns in the market. Nevertheless, after one day of stalling on October 18, the market sold off sharply, erasing all of its gains from August and September:


                    Finally, let’s look at our most recent sell signal that was issued on February 25, 2013 (just four days ago). Much like the price action that followed the most recent sell signal from October of 2012, stocks did not sell off right away. Rather, the broad market bounced higher for a few days:


                    Because we are not mystical prophets, we don’t know if the market will sell off sharply over the next few weeks. Nevertheless, we have not been willing to establish new long positions over the past few days (though we entered a few new short positions) because experience has shown us exactly what can happen when the volume patterns in the market suddenly turn bearish.

                    Although the market pushed higher on February 26 and 27, it did so on lighter volume. This followed three out of four big declines on higher volume. Yesterday (February 2, the market stalled, which reinforced the sell signal generated by our stock market timing model on February 25.

                    Quite a few supposed “gurus” claim that market timing doesn’t work, but those who believe this are clearly not following the right indicators. Broad market volume patterns, combined with poor performance by leading individual stocks, always play a crucial role in identifying significant market tops and bottoms.

                    Many investors make the mistake of focusing purely on price patterns or percentage gains of a broad-based index, while paying little or no attention to the market’s volume patterns. To learn more about why volume is such an important indicator, check out 5 Technical Reasons Stocks May Soon Move Lower, an article we wrote on October 8, 2012 (just four days before our October 12 “sell” signal highlighted above).

                    When volatility increases, trading can become quite emotional, which can easily lead to bad decisions and a ton of regret. The best way to remove (or at least minimize) emotions from trading is to follow a well-defined and disciplined trading strategy at all times.

                    Our proven system for market timing allows us to operate with confidence during stressful periods in the market. Are we wrong sometimes? Of course! But successful trading isn’t about being right or wrong (ego); rather, it’s about doing the right thing. When traders consistently do the right thing in trading, the money eventually follows.

                    Comment

                    • morpheustrading
                      Senior Member
                      • Sep 2012
                      • 131

                      #70
                      Who Will Win The Present Tug Of War Between The Bulls And Bears?

                      We spent several hours extensively scanning the markets over the weekend, and came to the conclusion that the current market environment is a choppy, sloppy mess. Although large-cap stocks continue to show relative strength, which enabled the Dow Jones Industrial Average to finish at a new 52-week high (on the weekly chart), the important Nasdaq Composite remains well below its prior highs from September of 2012.

                      Clearly, the market has become fractured over the past two weeks. Like the Dow, the benchmark S&P 500 Index finished the week near its 52-week high. Nevertheless, it is becoming quite apparent that a tug of war between the bulls and bears are starting to take place. To illustrate that, just take a look at the following daily chart of the S&P 500 SPDR ($SPY), a popular ETF proxy for the S&P 500 Index:


                      When such major day-to-day volatility starts taking place after an extended rally, it is often a warning sign that a significant correction is about to take place. Furthermore, the Nasdaq remains in a rather precarious position, as the index has been struggling to hold on to key intermediate-term support of its 50-day moving average.

                      If the Nasdaq convincingly breaks down below its 50-day MA in the coming week (by closing below last week’s lows), it will certainly have a substantial drag on even the Dow and S&P 500. Below is the chart of the PowerShares QQQ Trust ($QQQ), an ETF which tracks the performance of the large Nasdaq 100 Index (the brother of the broader-based Nasdaq Composite):


                      Although the broad market has been “whiplash city” over the past week, it’s important to note the bearish volume patterns in the broad market continue to persist.

                      Since the February 19 peak, three of the four down days have been on higher volume (“distribution days”), while all four up days have been on lighter volume. While many technical indicators give false signals, volume is the one indicator that never lies because it is a clear footprint of institutional trading activity.

                      Since banks, mutual funds, hedge funds, pension funds, and other institutions control more than 50% of the market’s average daily volume, the direction of the stock market nearly always follows the institutional money flow. Right now, the volume patterns tell us that institutions remain in sell mode (so our market timing model is as well).

                      Although our timing model in sell mode, we continue to monitor leading stocks with the most relative strength. The top individual stock presently on our internal watchlist is LinkedIn Corp. ($LNKD), which we have already bought and sold twice for solid gains the past two months.

                      The first buy of $LNKD was in January, based on a “cup and handle” type chart pattern, which we sold for an 11% gain ahead of earnings. The second buy was on a big gap up from its February 8 earnings report, which we also sold into strength for a nice profit (check our momentum swing trading blog for an educational technical review of that second swing trade entry soon).

                      Not surprisingly, a majority of the ETFs in our weekend stock screening have similar chart patterns to the major indices, but we did spot one pocket of relative strength in the healthcare sector. iShares Biotech ($IBB), SPDR Health Care ETF ($XLV) and Vanguard Health Care ETF ($VHT) have either broken out to new 52-week highs or are poised to breakout within the next few days. However, given recent market conditions, a breakout in the current environment would have a higher than usual likelihood of failure. Conversely, low-risk short selling setups remain minimal as well.

                      Overall, we do not see any low-risk stock or ETF swing trade setups that are presently actionable. Therefore, the best plan of action is to sit on the sidelines primarily in cash until the market shows us the direction of its next move. Remember, we’re not in the business of predicting price action. Rather, we simply plan our trades according to the reaction the market is presenting us at any given time. It’s a much less stressful and more profitable way to run your trading operations over the long-term.

                      Comment

                      • morpheustrading
                        Senior Member
                        • Sep 2012
                        • 131

                        #71
                        2 ETFs Setting Up For Low-Risk Trend Reversal Buy Entries ($TBT, $TAN)

                        With our stock and ETF swing trading strategy (details about that here), there are three main types of trade setups we take: breakouts above consolidation, pullbacks to near-term support (in uptrending stocks), and trend reversals. In healthy markets, we primarily focus on buying breakouts and pullbacks. However, we occasionally spot low-risk trend reversal setups, which often offer a very positive reward to risk ratio.

                        There are two new “official” ETF swing trade setups we are targeting for potential buy entry going into today’s session, both of which are trend reversal plays. The first is ProShares UltraShort 20+ Year Treasury Bond ETF ($TBT). The technical criteria for this setup is detailed on the weekly chart below:


                        Buying a trend reversal does NOT mean “bottom fishing,” which is akin to catching a falling knife. Rather, the stock or ETF must first indicate a high likelihood that a significant bottom has already been formed. For this, we specifically look for the stock or ETF to both trade in a sideways consolidation pattern for at least several months. More importantly, it must also form at least one “higher low” within that consolidation period (two is preferable).

                        Additionally, we always make sure the 10-week moving average (same as the 50-day moving average) has crossed above the 40-week moving average (same as 200-day moving average), which confirms the bearish momentum has reversed. Then, we buy the stock or ETF when it breaks out above the highs of its consolidation (horizontal price resistance).

                        As you can see on the chart above, $TBT meets all of these qualifications for a trend reversal play. The ETF has been consolidating in a sideways range since June 2012, and has formed two “higher lows” since then (November 2012 and February 2013). Then, after four weeks of tight consolidation near the high of its range, the ETF “undercut” support of its 10-week moving average just two weeks ago, but zoomed right back up to close at the highs of its range last week. Such price action is bullish and often precedes major breakouts.

                        Because $TBT is a leveraged inverse ETF, there is a degree of underperformance to the underlying index (long-term treasury bonds) as the holding period increases. Therefore, short selling iShares 20+ Year T-bond ETF ($TLT) is technically better than buying $TBT. However, since traders with a non-marginable cash account (IRA) are unable to short sell anything, $TBT or $TBF (non-leveraged version of $TBT) is a decent alternative. For this swing trade setup, members of The Wagner Daily trading newsletter should note our predefined and exact entry, stop, and target prices on the “watchlist” section of today’s report.

                        The second ETF trend reversal setup we are stalking for potential buy entry today is Guggenheim Solar ETF ($TAN). Like $TBT, this ETF meets the same trend reversal requirements on its weekly chart interval. However, it’s actually the daily chart pattern that makes this trade setup enticing. Take a look at the chart below:


                        In mid-February, $TAN attempted to break out above a five-week base of price consolidation (point “A”). However, the breakout failed, causing the ETF to fall back to the lows of its range (point “B”) less than two weeks later.

                        If you are new to trading, you may understandably assume failed breakouts are a bad thing. But the reality is that failed breakouts that hold support of the prior range often lead to some of the most explosive breakouts on the second breakout attempt. Since many traders buy the initial breakout attempt, then quickly sell when the breakout fails, it has the effect of absorbing overhead supply. In turn, this makes it easier for the stock or ETF to zoom higher on its next move up.

                        In the case of $TAN, we like that the ETF firmly found support at the lows of its prior range, which has conveniently converged with major support of its 200-day moving average (orange line). If this ETF triggers for buy entry, bullish momentum should cause it to surge above last month’s high shortly thereafter. Again, Wagner Daily subscribers should note our detailed parameters for this trade setup on today’s watchlist.

                        Comment

                        • morpheustrading
                          Senior Member
                          • Sep 2012
                          • 131

                          #72
                          3 New ETF Swing Trade Setups – Breakout, Trend Reversal, & Short Sale

                          In yesterday’s ETF commentary, we pointed out the developing bullish setup in SPDR Energy ETF ($XLE). However, as the ETF had not yet broken out to new highs, we said it may need another week or two of consolidation, as well as tightening of the price action near its prior high.

                          While $XLE remains on our internal watchlist as a potential buy entry in the near-term, further research enabled us to actually find a better ETFs swing trade setup within the same industry sector. Below, take a look at the daily chart of SPDR Oil & Gas Exploration and Production ETF ($XOP):


                          The primary difference between $XLE and $XOP is that the former has not yet broken out above resistance of its February 2013 high, while the latter already has. This means $XOP has been showing slightly more relative strength than $XLE. On the longer-term weekly chart below, notice that $XOP has also just broken out above key horizontal price resistance of its prior high from September of 2012, which should further spark bullish momentum from here:


                          Over the next few days, $XOP may form a bull flag chart pattern by drifting slightly lower from the high of this week’s breakout (as shown on the first chart above). If it does, it could lead to an ideal swing trade setup, as new support of the February 2013 breakout level is just below the current price. However, just in case the ETF immediately continues higher from here, without forming a bull flag first, we have added $XOP to today’s watchlist as an “official” trade setup going into today’s session.

                          Since $XOP is presently only 1% above its breakout level, it’s not too far extended to take a shot from here if it continues higher. However, if the ETF trades through our trigger price (above the two-day high), we will reduce risk by only entering with partial share size on this momentum trade setup. Conversely, we may be more inclined to enter with larger share size if a bull flag pattern first develops from here instead, as that would increase the odds of follow-through to the upside.

                          In addition to $XOP, there are two other “official” ETF swing trade setups, as well as two new individual stock trade setups, going into today.

                          One new ETF setup is a buy entry into ProShares Short 20+ Year Treasury Bond ETF ($TBF) if it rallies above last week’s high. A similar trade to buy $TBT on a breakout above last week’s high was listed on our watchlist earlier this week (Monday), but it did not trigger and we removed it.

                          Now, we have added the short ETF back to our watchlist, but are targeting the non-leveraged ETF ($TBF), rather than the leveraged one ($TBT), because there will be a slightly better correlation to the underlying index if $TBF triggers for buy entry. Please reference this March 11 blog post for a technical review of this potential Trend Reversal setup in $TBT/$TBF (or $TLT short if you are able)

                          The third and final new ETF trade setup on today’s watchlist is a potential short selling entry into SPDR Metals & Mining ETF ($XME). Although our market timing model is still in “buy” mode, this sector has been absolutely dead, trading near the 52-week lows while the market trades at its highs. Therefore, because of its relative weakness, even the slightest pullback in the market should cause this ETF to fall apart to new lows. We will explain the actual technical criteria behind the $XME setup in tomorrow’s Wagner Daily newsletter.

                          In the meantime, regular subscribers should note our exact entry, stop, and target prices of the $XOP breakout, $TBF trend reversal, and $XME short selling setup in today’s report. Trade details for our two new stock swing trade setups ($ALNY and $SWFT) are also discussed in today’s stock swing trading report.

                          Comment

                          • morpheustrading
                            Senior Member
                            • Sep 2012
                            • 131

                            #73
                            How To Profit From The Break Of The 6-Year Uptrend in Gold ($GLD)

                            The impressive, long-term uptrend in gold (from 2005 to 2011) appears to be reaching an end. Since forming an all-time high in September 2011, SPDR Gold Trust ($GLD), a popular ETF proxy for the spot gold commodity, has merely been oscillating in a sideways range. However, it appears that a definitive move lower is on the horizon in the coming weeks.

                            On the weekly chart of $GLD below, notice that the ETF attempted to break out above key horizontal price resistance in October 2012, but was unable to do so. As such, $GLD formed a significant “lower high” on its long-term chart. Nevertheless, there’s still a major base of horizontal price support around the $150 level:


                            The next near-term move in $GLD could be a bounce into resistance in the $158 to $160 range. In this area, there is new resistance of the prior lows from December 2012 and January 2013, as well as resistance of the 10-week moving average (roughly the same as the 50-day moving average) and the 40-week moving average (approximately equal to the 200-day moving average).

                            If $GLD bounces to this level and stalls, it will form a second significant “lower high.” This would be bearish and could easily lead to a breakdown below major support at the $150 area on the next move down.

                            Another possible scenario for $GLD is that it fails to bounce much higher and simply breaks below its four-week base of support (below $150) without first forming another lower high.

                            Regardless of how $GLD plays out, we have added this precious metal ETF to our internal watchlist as a potential short sale entry in the coming weeks. Traders with non-marginable cash accounts (meaning they can’t sell short) could simply buy an inversely correlated “short ETF” (such as $DGZ) instead.

                            A short sale entry into $GLD would be based on whichever of the two scenarios occur first: a bounce to the $158 to $160 area that stalls OR a breakdown below the $150 support level that subsequently bounces into resistance. As always, we will give our newsletter subscribers a heads up with our exact entry, stop, and target prices if we add this swing trade setup to our” official” watchlist. But for now, we are waiting to see how the next near-term move plays out.

                            As a reminder, we never sell short into strength (here is how we do it instead). So, even if $GLD bounces into resistance of the $158 to $160 level, our trading rules are such that we must subsequently wait for the first big gap down or significant down day that follows. Entering a short position while a stock or ETF is still rallying has a very high risk of getting your stop run. The much lower-risk entry point is waiting for the price to start heading back down, thereby immediately putting the odds in your favor.

                            Comment

                            • morpheustrading
                              Senior Member
                              • Sep 2012
                              • 131

                              #74
                              How To Trade The Bearish Head & Shoulders Pattern In $QQQ (Nasdaq 100)

                              One ETF we have been watching closely for potential swing trade entry in recent weeks is PowerShares QQQ Trust ($QQQ), a popular ETF proxy for the tech-heavy Nasdaq 100 Index. Specifically, we have been monitoring a bearish head and shoulders pattern that has been developing on the weekly chart interval of $QQQ.

                              If this bearish chart pattern starts following through to the downside, it may create a low-risk entry point for short selling $QQQ (or buying a short ETF such as $PSQ or $QID). In this article, we walk you through the details of this technical trade setup for $QQQ, and present you with the most ideal scenario for actionable trade entry. For starters, check out the annotated weekly chart pattern of $QQQ below:


                              When determining the validity of a head and shoulders pattern, there are a few factors we look for to determine whether or not this bearish pattern is likely to follow through to the downside.

                              One of the biggest technical considerations is the trend of the volume that accompanied the price. The best head and shoulders patterns will be marked by higher volume on the left shoulder and lighter volume on the right shoulder. Such a pattern indicates decreasing buying interest as the pattern progresses. As you can see by the 10-week moving average of volume (the pink line on the volume bars above), volume has indeed been declining during the formation of the right shoulder.

                              Another element we look for is whether the neckline is perfectly horizontal, ascending, or descending. The neckline on the $QQQ chart above is ascending, which means a “higher low” was formed. This ascending neckline slightly decreases the odds of the head and shoulders following through by breaking below the neckline. Nevertheless, between the two technical elements of the volume trend and angle of the neckline, volume is considered a more significant factor in determining whether or not the price is likely to move lower after the right shoulder has formed.

                              Since it’s always best to assess a potential swing trade setup on multiple chart time frames, let’s zoom into the rather interesting, shorter-term daily chart interval of $QQQ:


                              Just as the “line in the sand” for price support of $SPY is last week’s low, the same is true of $QQQ, but even more so.

                              Notice how support of last week’s low in $QQQ neatly converges with both the 50-day moving average (teal line) AND the intermediate-term uptrend line from the November 2012 low (red line). The more technical indicators that converge in one area to form price support, the more substantial and pivotal that support level becomes. As such, be sure to monitor the $67.60 area very closely in the coming days, as a convincing breakdown below that level could be the impetus that sends $QQQ on its way down to testing the neckline of its head and shoulders pattern.

                              Despite the convincing head and shoulders pattern of $QQQ, it is important to keep the following two things in mind:

                              First, due in no small part to recent weakness in heavily-weighted Apple Computer ($AAPL), the Nasdaq has been a laggard throughout the multi-month rally in the broad market. Rather, the blue chip Dow Jones Industrial Average has been leading, and that index still remains very near its multi-year highs. In a fractured market with significant divergence between the major indices, clear follow-through in either direction usually does not come easily.

                              The second (and more important) point is that the head and shoulders pattern, like all technical chart patterns, obviously does NOT work 100% of the time. In fact, far from it. This means that blindly selling short $QQQ (or buying an inversely correlated “short ETF”) at the current price level of $QQQ is risky and not advisable.

                              Instead of entering this swing trade setup based purely on anticipation of the pattern working, our technical trading system mandates that we first wait for price confirmation that indicates momentum has shifted back in favor of the bears. At a minimum, we would NOT enter a short position unless/until $QQQ breaks down below last week’s low, which we now know is a key level of price support. Jumping the gun by trying to get an “early” entry point is never advisable in swing trading.

                              As always, we will give regular subscribers of our ETF and stock momentum trading newsletter a heads-up in advance if/when $QQQ gets added to our “official” watchlist for short/inverse ETF swing trade entry.

                              Comment

                              • morpheustrading
                                Senior Member
                                • Sep 2012
                                • 131

                                #75
                                How To Trade Around Earnings Reports With Maximum Profits And Low Risk

                                The challenge of trading around quarterly earnings reports

                                When I first began my trading career about 15 years ago, I had no idea how to manage trades that coincided with the quarterly earnings reports of various stocks. Whenever I simply held my positions through earnings and hoped for the best, I was somehow wrong a majority of the time, and the stocks gapped sharply against me. Conversely, I found that I missed out on a lot of potential profits whenever I simply stood aside and let the stocks react and do their thing after earnings.

                                Fortunately, many years later, I discovered a system for trading around earnings reports that enabled me to have minimal risk, while still capitalizing on the majority of the gains. It became the best of both worlds, and that is what I want to share with you in this article, using an actual recent trade example.

                                How we traded LinkedIn Corp ($LNKD) for a total 22% gain around its Q1, 2013 earnings report

                                Throughout January and February of this year, we made two separate swing trades to buy LinkedIn Corp ($LNKD) in The Wagner Daily newsletter. The first trade netted a gain of 11%, from our predefined entry and exit points, over a 14-day holding period. The second trade also scored an 11% gain, but with just a 9-day hold.

                                What’s notable about that total 22% gain with an overall holding period of 23 days is that the trades were made ahead of and immediately after the quarterly earnings report of $LNKD.

                                In this YouTube video, we walk you through the Earnings Trading Technique that enabled us to lock in these solid gains, despite both trades being centered around earnings reports.

                                Hope you find it to be educational and helpful. As always, feedback and questions are welcome!

                                Deron

                                Comment

                                Working...
                                X