I have 36 consecutive profitable trades of 15% or better. How is this possible? Every day there are hundreds of stocks setting new highs, no matter what happens in the overall market. Many of these stocks are still at very reasonable valuations. Afraid of buying stocks at their highs? Think of it this way: a new high is really a future floor for companies with solid financial underpinnings. Quantitative momentum modeling makes it easy to identify stocks that can continue this upward momentum trend. Why does this happen? It's really very simple..ask me about what investors and cows have in common. I am $$$ MR. MARKET $$$. I AM HUGE!!! Bring me your finest meats and cheeses. You can join in on the fun. Register for free and you'll be able to post messages on this forum and also receive emails when $$$ MR. MARKET $$$ makes his own trades. ($$$MR. MARKET$$$ is a proprietary investor and does not provide individual financial advice. The stocks mentioned on this forum do not represent individual buy or sell recommendations and should not be viewed as such. Individual investors should consider speaking with a professional investment adviser before making any investment decisions.)
If this is your first visit, be sure to
check out the FAQ by clicking the
link above. You may have to register
before you can post: click the register link above to proceed. To start viewing messages,
select the forum that you want to visit from the selection below.
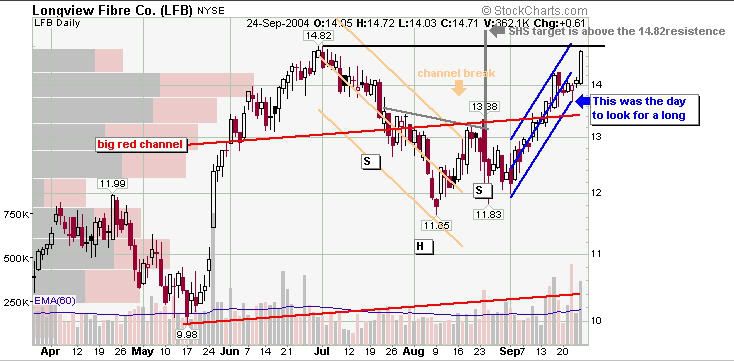
Hi Spike...I have been running some scans today and this one popped up on an EPS scan I ran...Anyway, if you have some time I'd appreciate your take from a technical perspective...Thanks, IIC
EDIT: Sorry about that...I forgot to give you the ticker...LOL...no that's not it...The symbol is:
LFB
Last edited by IIC; 09-25-2004, 05:45 PM.
Reason: Forgot to post the Ticker Symbol...LOL
"Trade What Is Happening...Not What You Think Is Gonna Happen"
I know you're getting a lot of these TA requests today, but if you could do one more for me I'd appreciate it:
NUS
I'm looking to enter this one again. I sold my original position at a 14% gain but we're back to the original $24 price again, so I'd like to take it for another ride with the $$MM gang. But I did the same thing with SSNC (sold for a 15% gain, then bought back again at the orginal entry price) only to see it take another 40% haircut. Do you see this as a good place to get back in, or is waiting for a better entry the correct thing to do from a TA perspective?
Hi Spike...I have been running some scans today and this one popped up on an EPS scan I ran...Anyway, if you have some time I'd appreciate your take from a technical perspective...Thanks, IIC
EDIT: Sorry about that...I forgot to give you the ticker...LOL...no that's not it...The symbol is:
LFB
Hi. Looks bullish to me. The best day to enter was the channel day Wednesday, and it's now approaching that resistence, so entry point is tricky now. A good target is the upper channel currently at 17.25, a nice 20% from where it currently is.
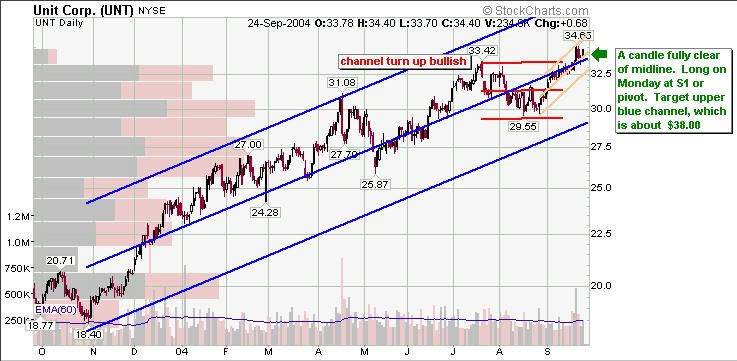
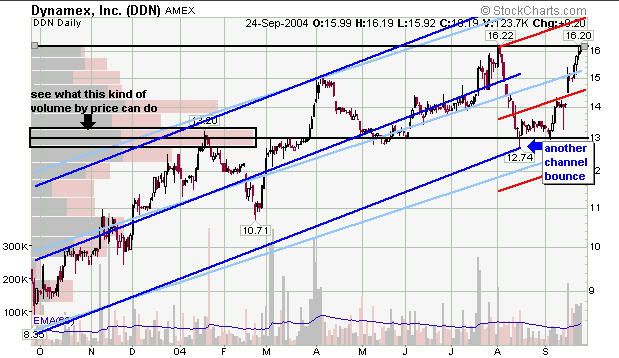
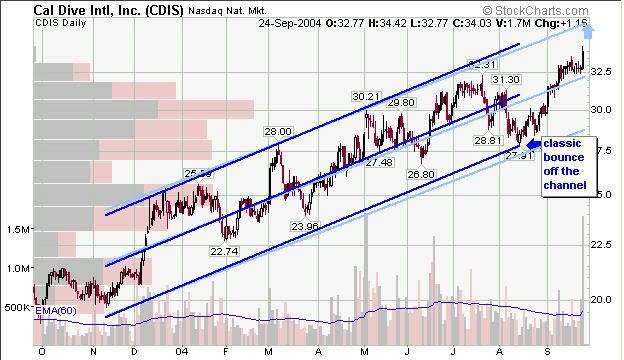
Spike, I want to buy at least one of these Monday: CDIS DDN UNT. DO any of them signal ' buy me now ' with their chart action? Thanks,
billyjoe
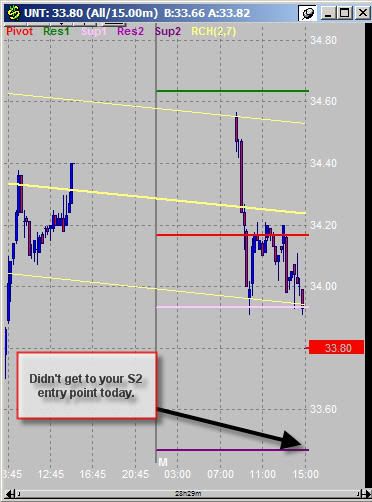
Well, if you must buy on Monday, I would recommend UNT. That has a cleared candle above channel midline support, it's just cleared resistence, and a nice target of 38.00. The stop loss is the trick part. If you're going to look at an intraday chart to open your position, you could try for S2 entry with a flat 4% stop loss, or you could look for an intraday pattern and put your stop tucked under LOD, or you could go long at the open or pivot and put a wider stop tucked under 32.50. So decide what fits your trading style best and go for it.
Here's the chart:
As for the other two, DDN is right at resistence, and CDI has run away from a sensible entry point and is fast approaching upper channel resistence, although it is still a nice bullish chart.
Spike,
I know you're getting a lot of these TA requests today, but if you could do one more for me I'd appreciate it: NUS I'm looking to enter this one again. I sold my original position at a 14% gain but we're back to the original $24 price again, so I'd like to take it for another ride with the $$MM gang. But I did the same thing with SSNC (sold for a 15% gain, then bought back again at the orginal entry price) only to see it take another 40% haircut. Do you see this as a good place to get back in, or is waiting for a better entry the correct thing to do from a TA perspective?
Thanks,
jiesen
No problem! Well done on that nice NUS trade.
Looking at the chart, it seems that it's time to move to greener pastures. NUS just failed to keep the red channel upwards. This is an early warning that I will not ignore, and I suggest if you want to trade NUS, look to go long at the lower blue channel, down near $21.90. It's likely that the gap at 23.58 will be tested imo.
Great, thanks for the tip, Spike! I'll try to incorporate this into my reentry and wait for a more attractive price, maybe the lower blue channel or around $22.
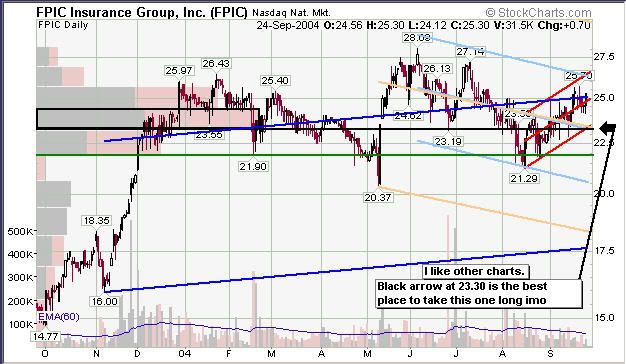
Mister Spike, if you could find it in your heart would you please look at FPIC and lay one of your interpatations on us all. for this just might be to your likeing and you may just say good jod grasshoppppper go now and bring me back more. thanks in advance ====> MEA
Mister Spike, if you could find it in your heart would you please look at FPIC and lay one of your interpatations on us all. for this just might be to your likeing and you may just say good jod grasshoppppper go now and bring me back more. thanks in advance ====> MEA
jod grasshoppppppppper go now and bring me back more!
This chart doesn't do much for me, but if I had to pick a good spot to take it long, that black arrow is at good support.
Spike im tryin to get the hang of this TA thing. Im looking at SNDK, I see my buy at 27, and my sell stop at 25.50. 27 would be a buy at the lower channel of its recent uptrend and a sell stop of 25.50 would be the lower channel of its initial run up, key support.(I wish i could attach my chart so you could give me some advice)
what do you think
thanks
TJK

 Tweet
Tweet


Comment